The median free-to-paid conversion rate in 2026 is 8%. Almost no product actually converts at 8%.
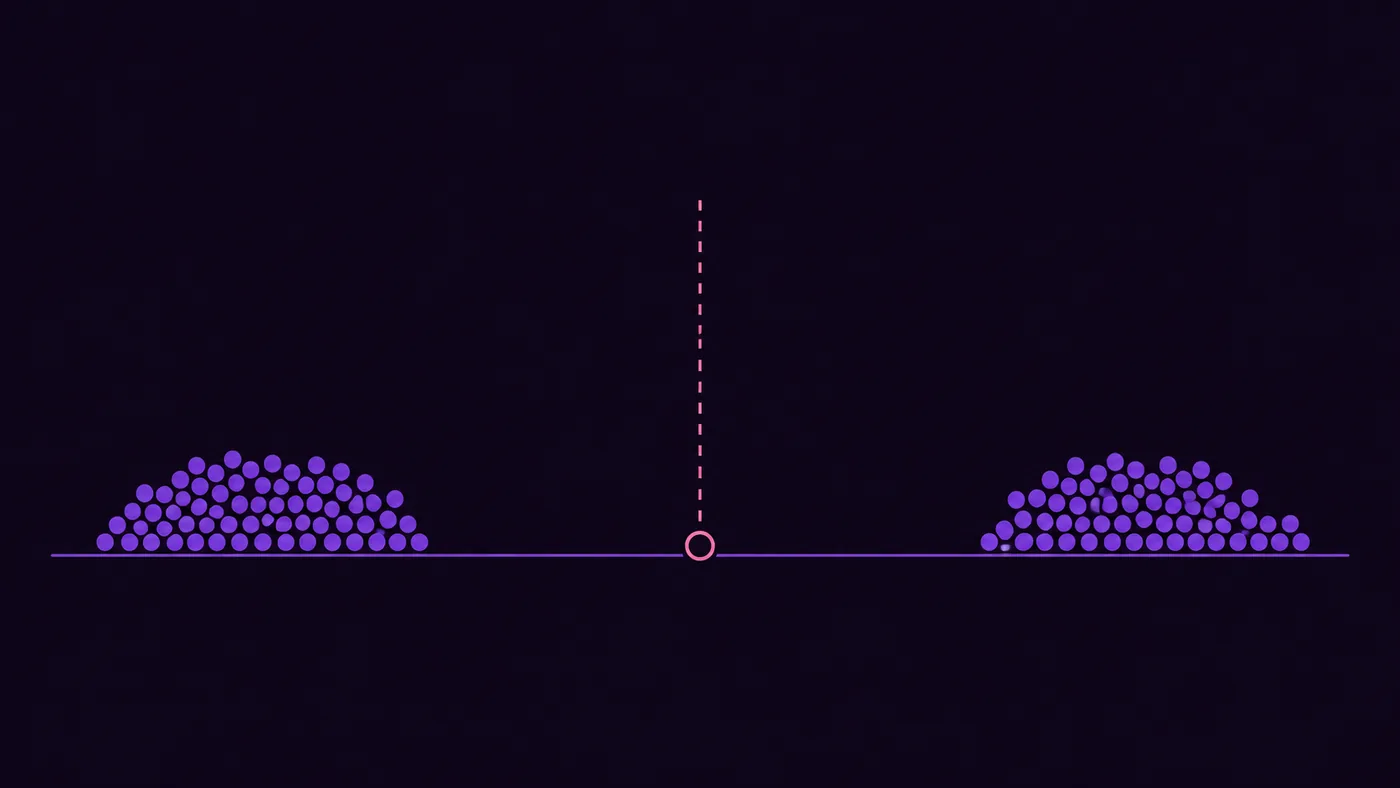
The number comes from ChartMogul and ProductLed's January 2026 survey of 200 software products, and one layer deeper it dissolves: a quarter of freemium products convert under 2.5%, another quarter land between 10 and 15%. The median sits in the gap between two crowds. Quote it as a target and you're aiming at a spot where almost nobody lives.
So this is the version of the benchmark post that shows the spread instead of the point: free-to-paid by motion, the two datasets that give two different answers, the arithmetic that decides freemium-versus-trial properly, and — the part every benchmark listicle skips — which of these numbers your analytics can actually see.
Free-to-paid by motion, 2026
The monetization motion moves this number more than your industry, your pricing, or your onboarding. Compare across motions and you're comparing nothing.
| Motion | Converts from | Median | The spread |
|---|---|---|---|
| Freemium | free users | ~4–8% (see below) | 25% of products under 2.5%, 25% at 10–15% |
| Free trial, no card | trials | ~12% | 20% under 2.5%, 23% above 25% |
| Free trial, card upfront | trials | ~30–50% | 4–5x the no-card rate — with a catch |
| Reverse trial | free users | ~7–10% | — |
| Interactive demo | demo users | ~7% | — |
The freemium row is the one with the double crowd. The middle is thin — 29% of products sit in the 2.5–7.5% band, and the rest split toward the edges. There is no "typical freemium product." There are products where the free tier sells the upgrade, and products where it quietly replaces it.
The card-upfront row needs its asterisk. The 2026 survey pegs card-required trials at a 30% median; older composites run as high as 50%. Both agree on the direction and both hide the same trade: the card crushes trial starts, so the higher rate applies to a much smaller cohort. The SaaS benchmarks article walks through why that 4–5x gap mostly moves friction around instead of creating customers.
And the demo row answers a question people actually search for: interactive demos convert about 7% of demo users to paid — a rate, not a miracle. A sales-led demo-to-close is a different metric with a different denominator; don't benchmark one against the other.
Two datasets, two answers
Here's the part that makes most freemium benchmark posts quietly useless: the two best public sources disagree, and the disagreement is the lesson.
The ChartMogul/ProductLed survey says median 8%. First Page Sage, pulling from 80+ agency clients between 2022 and 2026, says the average freemium-to-paid rate is 3.7%, with visitor-to-freemium-signup at 13.7%. Their industry spread:
| Industry | Freemium → paid |
|---|---|
| Legal / LegalTech | 6.1% |
| RegTech | 5.3% |
| ERP | 5.2% |
| Real estate / PropTech | 2.9% |
| Education / EdTech | 2.6% |
| All-industry average | 3.7% |
Neither is wrong. The survey population skews product-led companies at $1–10M ARR that chose to answer a PLG survey — teams whose whole growth model is the free tier. The agency population is whoever hires an SEO agency. If your product is PLG-native, benchmark against the survey's quartiles. If freemium is just one door into an otherwise ordinary funnel, 3.7% is your peer set, and hitting 5% puts you near the top of it. Picking the right crowd to compare against is most of the job — how to use benchmarks without fooling yourself is the longer version.
The rate is the wrong scoreboard
Freemium converts at 4%. Free trials convert at 12%. Therefore trials win. That's the wrong conclusion I hear most often in monetization conversations, and the arithmetic below is the cure.
Payers per 1,000 visitors = signup rate × free-to-paid rate. Run it both ways:
Freemium, agency numbers: 13.7% of 1,000 visitors sign up = 137 free users. At 3.7% free-to-paid, that's 5.1 paying customers.
No-card trial, composite medians: 3.8% of 1,000 visitors start a trial = 38 trials. At 12% trial-to-paid, that's 4.6 paying customers.
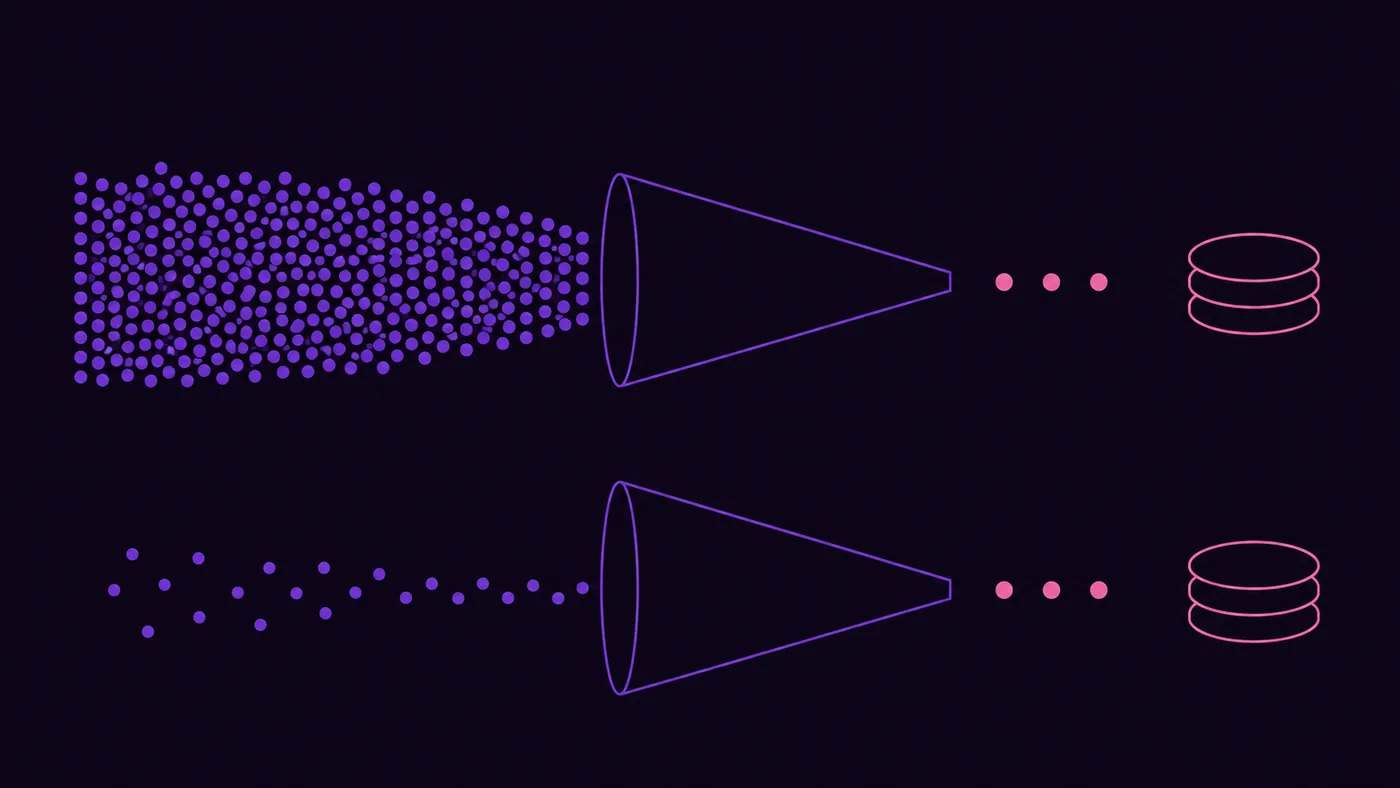
The trial "wins" 12% to 3.7% on rate and loses on customers. Now flip the freemium inputs to the weaker crowd — a 5% signup rate and 4% conversion — and freemium yields 2.0 payers to the trial's 4.6, a decisive loss with the same benchmark table. The rate alone cannot tell you which motion is winning. The pair can. Any benchmark comparison that doesn't multiply both numbers is theater.
Where your free-to-paid rate actually leaks
Free-to-paid factors into two stages: signup → activation, and activation → paid. Published composites put median signup-to-activation around 34%, with the healthy band running 25–45%. Most products I've looked at that convert under 2.5% don't have a pricing problem — they have an activation problem wearing a pricing costume. Users sign up, never reach the first moment of value, and no upgrade prompt in the world converts someone who got nothing out of the free tier.
Which means the diagnostic order is fixed: split your free-to-paid rate into its two factors before touching the paywall. The arithmetic in the next section shows why.
A worked example
A freemium note-taking tool, real-looking numbers. 60,000 visitors a month, 3,120 signups (5.2%, mid-band for freemium), and 66 new paying customers a month. Free-to-paid: 2.1%. The founder reads "median 8%," concludes the pricing page is broken, and starts redesigning the paywall.
The billing data says otherwise. Signup-to-activation is 18% against a ~34% median, barely half. Post-activation conversion is 11.7% (0.18 × 0.117 = 2.1%), which is fine. The paywall isn't the leak. The empty-workspace moment before it is.
Sizing the fix, arithmetic shown: lift activation from 18% to 30% (still below the median) at a constant post-activation rate, and free-to-paid becomes 0.30 × 0.117 = 3.5%. On the same 3,120 signups that's 109 paying customers, +43 a month. At their $19 ARPU, about +$817 in new MRR every month, compounding. Two labeled assumptions: activation reaches 30%, and the post-activation rate holds. Both are arguable — that's the point of writing them down.
Redesigning the paywall first would have optimized the 11.7% that was already fine.
Which of these numbers you can actually see
The benchmark posts never say this: free-to-paid does not live in your web analytics. GA4 watches a visitor sign up and then the trail ends; the upgrade happens in Stripe or your product database weeks later. Any tool that claims to read your freemium conversion rate "from GA4" is inventing it.
What GA4 does hold is the front half of the yield arithmetic: visitor-to-signup by source, pricing-page reach, and signup form completion, all computable the moment you mark sign_up as a Key Event. That's a ten-minute toggle most SaaS setups skip. The GA4-for-SaaS playbook covers wiring those events so they read correctly. The back half — activation, free-to-paid, ARPU — comes from billing, and gluing the two halves together is exactly the split the worked example above runs.
FAQ
What is a good freemium conversion rate? Under 2.5% puts you in the bottom quarter of freemium products; 10–15% is the top quarter. Against the agency-client composite (average 3.7%), anything above 5% is strong. But grade yourself against the crowd you actually belong to — PLG-native products run higher than products where freemium is a side door.
Freemium vs free trial — which converts better? Trials convert more of their users (median ~12% vs ~4–8%), freemium usually signs up far more of its visitors. Multiply both numbers — signup rate × conversion rate — and compare payers per 1,000 visitors. With typical inputs the two motions land within a customer of each other, which is why the "trials convert 3x better" headline keeps selling the wrong migration.
What is a good demo conversion rate for SaaS? Interactive product demos convert about 7% of demo users to paid in the 2026 ChartMogul/ProductLed data. That's demo-user-to-paid, self-serve. Sales-led demo-booked-to-closed-won is a different funnel measured over booked meetings — typically quoted at 20%+ and not comparable.
Is a 3% free-to-paid conversion rate bad? It's inside the 2.5–7.5% band where 29% of freemium products sit, and a hair under the 3.7% agency-client average. Ordinary, not broken. Before trying to move it, split it: activation rate × post-activation conversion. If activation is under ~25%, the 3% is a symptom and the onboarding is the problem.
The 8% median is a place to start an argument, not to end one. Your number, split into its two factors and set against the right crowd, ends it. The signup half of that arithmetic is sitting in your GA4 right now — the SaaS benchmark bands are the fastest way to see where you land, and connecting your GA4 gets you the split by source in one question.