Docs / Segment comparison
What runs when you compare two segments
Puts two segments side by side on the same metrics with computed deltas, plus the ready-made device and country splits.
Signature
cr_compare_segmentsTwo segments side by side on the same metrics, with computed deltas.cr_get_device_breakdownMobile, desktop and tablet: session share and conversion rate per device.cr_get_geo_breakdownTop countries by sessions or revenue, with conversion rate per country.
What you ask
- Compare mobile and desktop on sessions, conversion rate and revenue. Show it as a table and tell me whether the difference is statistically significant.
What runs
What comes back
Compare mobile and desktop on sessions, conversion rate and revenue. Show it as a table and tell me whether the difference is statistically significant.
Mobile vs desktop, July 4 to August 2, 2026: Mobile — 28,009 sessions, 0.27% conversion, $17,353.78 revenue Desktop — 12,506 sessions, 0.24% conversion, $7,088.31 revenue Difference — +15,503 sessions, +0.03 pp, +$10,265.47 The conversion-rate difference is not statistically significant. Two-sided z-test: z = 0.51, p = 0.610. The 95% confidence interval is −0.077 to +0.133 percentage points. Mobile generates 69.1% of sessions and 71% of revenue, but its apparent conversion advantage could easily be random variation rather than genuine better performance.
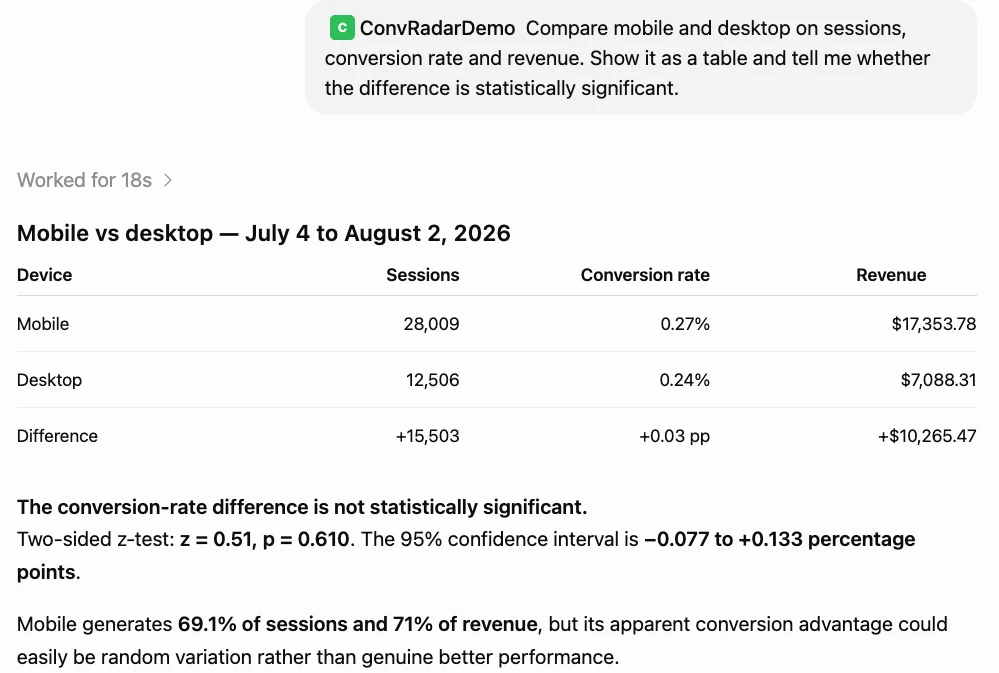
ChatGPT · GPT-5.6 Sol · captured 2026-08-03 · Demo Shop, data window 2026-03-28 to 2026-08-02
When to reach for this
Use this when you already have a suspect
Mobile against desktop, paid against organic, new against returning, one country against another. You bring the two groups; it puts them on the same metrics with the deltas computed and tells you whether the gap survives a significance test. That last part is the reason to use it rather than reading two numbers off a dashboard.
Not this one if you do not know who to blame yet
This compares two named groups. If the question is "who is dropping" with no candidate in mind, funnel leak diagnosis decomposes the worst step across device, source, visitor type, country and landing page in one pass and hands you the suspect. Come back here afterwards to put the number on it.
How to read it
The most useful answer this instrument gives is "no"
In the run above, mobile converts at 0.27% and desktop at 0.24%. That reads like a twelve percent relative advantage for mobile, and it is exactly the kind of gap that gets written into a strategy deck. The z-test says z = 0.51, p = 0.610: at this volume the difference is indistinguishable from noise. The instrument earns its keep here by stopping a conclusion, not by producing one.
Read the confidence interval, not just the verdict
The interval is −0.077 to +0.133 percentage points. It straddles zero, which is another way of saying the true difference could just as easily run the other way. An interval that wide also tells you something useful about the future: you would need considerably more traffic before a gap this size could ever be called, so "run it longer" is a real option and "it is close enough to act on" is not.
Share of sessions and share of revenue are a different finding
Mobile is 69.1% of sessions and 71% of revenue. That pair does not depend on the significance test and is worth reading on its own: it says mobile is where this business happens, regardless of whether its conversion rate is genuinely better. A device that carries seven in ten of your sales deserves the attention even when the rate difference is a coin flip.
Revenue is compared, but it is not tested
The table shows a $10,265 revenue gap and the test is run on the conversion rate. Revenue per session has a much heavier tail than a binary conversion, so a z-test on proportions is the right tool for the rate and the wrong one for the money. Treat the revenue column as description and the rate as the tested claim.
Limits
- The significance test is a two-sided z-test on proportions. It is right for conversion rate and wrong for revenue per session or average order value, and it is not applied to those.
- It compares two groups on the window you give it. It is not an A/B test: the groups were not randomised, so a difference that does clear significance still shows correlation and not cause.
- Small segments will almost never reach significance, and that is the correct answer rather than a failure. A few hundred sessions cannot resolve a few tenths of a percentage point.
- It compares; it does not explain. Knowing mobile and desktop differ tells you nothing about which element on the page causes it.
Related instruments
Go deeper
Try it on your own data
Every instrument runs on your own GA4, read-only, inside Claude or ChatGPT. One connector covers all of them.
Add the connector →Session captured 2026-08-03 against the ConvRadar demo property. Masked in the image: cropped to the conversation column, so the account sidebar and workspace name are out of frame, no connector URL is in frame, so no token can leak, no account email or avatar is in frame.