Docs / Benchmarks
What runs when you ask how you compare to your industry
Your headline metrics against the band for your vertical, with the vertical auto-detected from the property when you do not name one.
Signature
cr_compare_to_benchmarkYour headline metrics against the band for your vertical, auto-detected when you do not name one.
What you ask
- How does my conversion rate and AOV compare to my industry benchmark? Show it as a table with my number, the benchmark band, and where I sit.
What runs
What comes back
How does my conversion rate and AOV compare to my industry benchmark? Show it as a table with my number, the benchmark band, and where I sit.
Using the last 30 days available, July 4 to August 2, 2026, and the general ecommerce benchmark: Conversion rate — your number 0.23% — benchmark band P25 to P75 is 1.2% to 3.4%, median 2.2% — below P25, about 90% below median. Average order value — your number $265.90 — benchmark band $42 to $110, median $68 — above P75, about 291% above median. Bottom line: your customers spend substantially more than average when they buy, but far fewer visitors complete a purchase. The main growth opportunity is conversion rate rather than increasing basket size. These are generic ecommerce bands; a knife, premium-goods or specialty-retail benchmark would provide a tighter comparison.
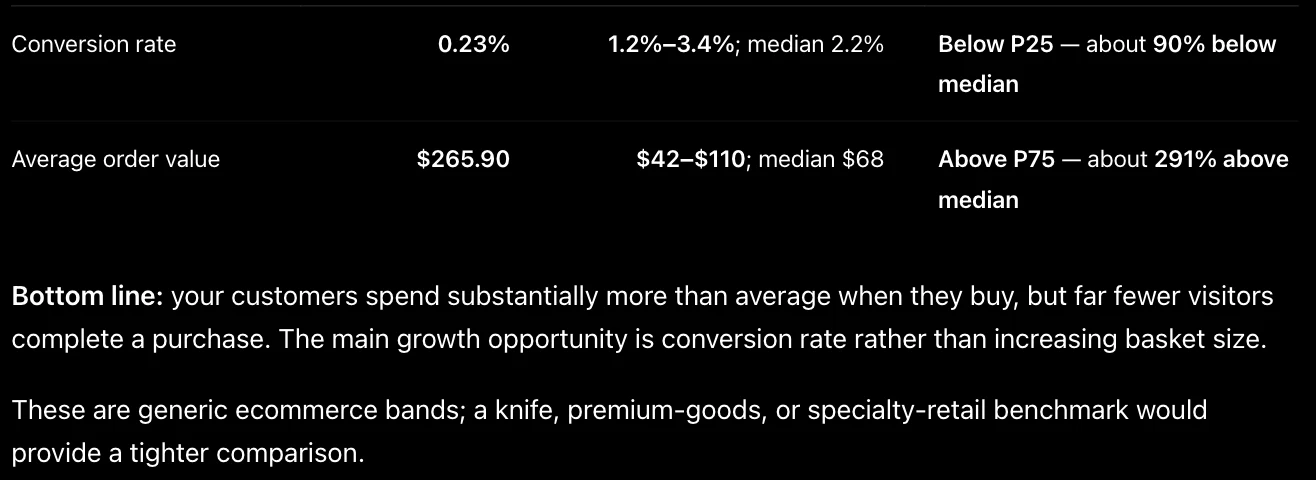
ChatGPT · GPT-5.6 Sol · captured 2026-08-03 · Demo Shop, data window 2026-03-28 to 2026-08-02
When to reach for this
Use this to find out whether a number is a problem
0.23% conversion means nothing on its own. Against a band of 1.2 to 3.4% it means something specific. This is the instrument for deciding whether the thing you are worried about is actually unusual, before you spend a quarter on it.
Use it to pick which lever to pull
The run above answers a strategy question, not a diagnostic one. Conversion sits below the 25th percentile and basket size sits above the 75th, so the growth is in conversion and not in upsell. That is the kind of call a benchmark is genuinely good for.
Not this one for a target
A band is where comparable businesses land, not where yours should. It tells you that something is unusual; it never tells you what your number ought to be, and it cannot tell you what is achievable for your traffic mix.
How to read it
Read both rows before you read either one
Conversion 90% below median and AOV 291% above median is not two findings, it is one shape: few buyers, big baskets. That pattern is normal for high-consideration or premium goods and is not by itself evidence of a broken funnel. Reading only the red row would send you optimising something that may be working exactly as the category works.
P25 to P75 is the middle half, not the whole world
The band is an interquartile range: a quarter of comparable businesses sit below P25 and a quarter above P75. Being outside it means unusual, not wrong. Both of this property's numbers are outside the band in opposite directions, which is a strong hint that the generic band is the wrong band.
The caveat at the bottom is the most important line
It says these are generic ecommerce bands and that a knife, premium-goods or specialty-retail benchmark would be tighter. That is the answer telling you not to over-trust it. A $265 average order compared against a $68 median is comparing a specialty retailer to the whole of ecommerce, and the gap says as much about the comparison set as about the business.
Check the window before you quote the number
The comparison runs on the last 30 days available. A month that contained a traffic spike, a sale or an outage will move your side of the table without anything changing about the category. If the number surprises you, look at what that month contained before you act on the gap.
Limits
- Bands are directional and drawn from published research, not from a live panel of your competitors. They are a sanity check, not a scoreboard.
- The vertical is auto-detected when you do not name one, and a mis-detected vertical produces a confident comparison against the wrong peers.
- It compares; it does not diagnose. Knowing you are below P25 says nothing about which step is losing people.
- Metrics defined differently by different sources will not line up. Session-based and user-based conversion rates are not the same number, and a band built on one does not apply cleanly to the other.
Related instruments
Go deeper
Try it on your own data
Every instrument runs on your own GA4, read-only, inside Claude or ChatGPT. One connector covers all of them.
Add the connector →Session captured 2026-08-03 against the ConvRadar demo property. Masked in the image: cropped to the conversation column, so the account sidebar and workspace name are out of frame, no connector URL is in frame, so no token can leak, no account email or avatar is in frame.