Docs / Ask your data
What runs when you ask a free-form question about your GA4
No fixed report. The connector describes what data exists, then aggregates whatever metrics and dimensions your question needs.
Signature
cr_get_account_infoThe connected property's name, currency, timezone, available data window and site URL.cr_describe_dataWhat data actually exists for the property: the fact tables and the fields you can query on each.cr_get_overview_metricsHeadline KPIs for a window: sessions, conversion rate, revenue, average order value.cr_query_metricsFlexible aggregation over any fact table. Pick metrics and dimensions; the tool finds the table that carries them.
What you ask
- What data can you actually see for this property, and what were the headline numbers last month? List the tables you can query, then give me sessions, conversion rate, revenue and AOV.
What runs
What comes back
What data can you actually see for this property, and what were the headline numbers last month? List the tables you can query, then give me sessions, conversion rate, revenue and AOV.
For the connected property I can query GA4 data from March 28 through August 2, 2026. Tracking is classified as healthy, with e-commerce purchases and revenue available. Queryable tables: ga4_fact_funnel_daily — sessions, users, purchases and revenue by source, device and new/returning status ga4_fact_keyevent_daily — GA4 key-event conversions by source, device and visitor type ga4_fact_funnel_step_daily — event-level funnel steps such as view, cart, checkout and purchase ga4_fact_source_campaign_daily — source, medium, campaign and channel performance ga4_fact_landing_daily — landing-page traffic, engagement, purchases and revenue ga4_fact_landing_query_daily — landing pages including query-string variations ga4_fact_landing_step_daily — funnel events broken down by landing page ga4_fact_item_daily — product and SKU views, carts, checkouts, purchases and item revenue ga4_fact_geo_daily — performance by country, region, city and device ga4_fact_geo_source_daily — geography combined with source, medium and campaign ga4_fact_geo_event_daily — individual events by geography and device ga4_fact_product_page_daily — page views, engagement, purchases and revenue by URL ga4_fact_page_event_daily — commerce events associated with specific pages ga4_fact_purchase_detail — coupons, discounts, purchase revenue and currency Tracked commerce events are: page_view, view_item, add_to_cart, begin_checkout and purchase. July 2026 headline numbers, July 1 to 31 against the previous 31 days: Sessions 41,310, +25.1% Conversion rate 0.30%, −55.9% Revenue $30,514.29, −5.8% AOV $246.08, +70.1%
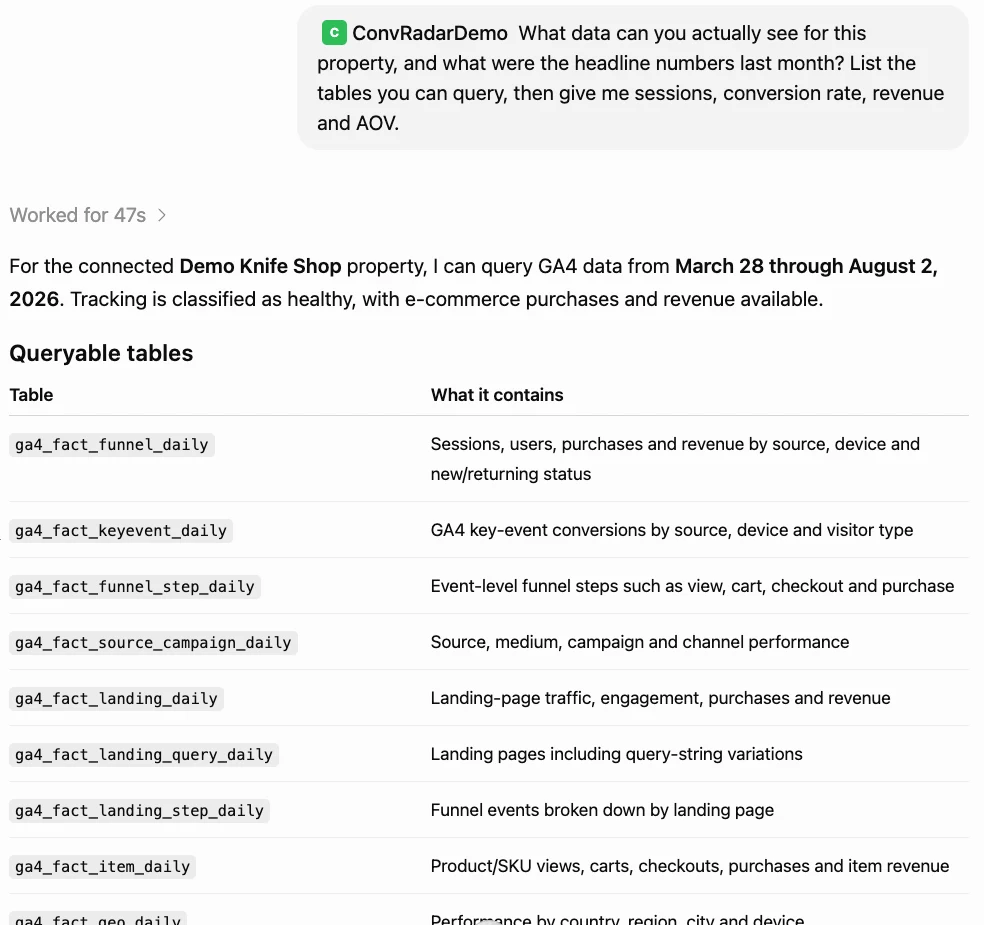
ChatGPT · GPT-5.6 Sol · captured 2026-08-03 · Demo Shop, data window 2026-03-28 to 2026-08-02
When to reach for this
Use this when your question has no fixed report
Every other instrument answers one shaped question. This one answers whatever you asked: revenue by country for returning visitors on mobile in July, or engagement on landing pages carrying a particular query string. It describes what exists, then aggregates it.
Use it first on a property you have never seen
Asking what the connector can query is the cheapest possible first prompt. It tells you the data window, whether commerce tracking is healthy, and which slices exist, so your next question is answerable rather than a guess.
Not this one when a named report already exists
If you want the funnel, the anomalies, the product diagnosis or a benchmark comparison, the dedicated instrument is faster and carries its own logic. This is the escape hatch for everything they do not cover.
How to read it
The table list is the map of what is answerable
Fourteen fact tables, each naming its grain. That list is the honest boundary of the connector: a question that needs a dimension no table carries cannot be answered, and the model will say so instead of inventing a number. Reading it once tells you more about what you can ask than any prompt guide.
Daily grain is why some questions cannot be answered
Every table ends in _daily. That means anything requiring individual user paths, session-level sequences or cohort tracking across weeks is out of scope by construction, not by omission. The upside is speed and no sampling; the trade is that this is aggregate analytics, not a data warehouse.
The four headline numbers must be read together
July shows sessions +25.1%, conversion rate −55.9%, revenue −5.8% and AOV +70.1%. Read alone, each one supports a different story. Read together they describe one event: a lot of extra traffic arrived and did not buy, while the people who did buy spent much more. That shape, volume up and rate down, is almost always an acquisition-mix change rather than a site problem.
"Tracking is healthy" is a precondition, not a compliment
The answer opens by classifying tracking health. If commerce events or revenue were missing, every number underneath would be a floor rather than a measurement, and the honest answer would be to fix tracking before analysing anything. Check that line before you trust the rest.
Limits
- Aggregated daily tables only. No user-level data, no session replay, no individual journeys, and no cohort tracking across time.
- It can only aggregate dimensions that exist in the tables above. A question needing a custom dimension you never sent to GA4 has no answer here.
- Data is synced, not live. Today's activity is not in the tables yet.
- It answers the question you asked. It will not volunteer that the number you asked for is misleading unless you ask why.
Related instruments
Go deeper
Try it on your own data
Every instrument runs on your own GA4, read-only, inside Claude or ChatGPT. One connector covers all of them.
Add the connector →Session captured 2026-08-03 against the ConvRadar demo property. Masked in the image: cropped to the conversation column, so the account sidebar and workspace name are out of frame, no connector URL is in frame, so no token can leak, no account email or avatar is in frame.