Docs / Traffic mix
What runs when you ask where your sessions come from
Source and medium breakdown with sessions, users and conversion rate per channel.
Signature
cr_get_traffic_breakdownTop sources broken down by source and medium, with sessions, users and conversion rate.
What you ask
- Where does my traffic come from? Show the top sources as a table: source and medium, sessions, users, conversion rate.
What runs
What comes back
Where does my traffic come from? Show the top sources as a table: source and medium, sessions, users, conversion rate.
Top traffic sources, July 4 to August 2, 2026: google / organic — 21,833 sessions, 18,658 users, 0.24% (direct) / (none) — 12,606 sessions, 11,767 users, 0.13% gearpatrol.com / referral — 1,586 sessions, 1,516 users, 0.00% bing / organic — 662 sessions, 574 users, 0.15% ig / social — 502 sessions, 480 users, 0.00% duckduckgo / organic — 433 sessions, 367 users, 0.00% yotpo / general — 272 sessions, 202 users, 0.37% youtube.com / referral — 166 sessions, 156 users, 0.60% facebook.com / referral — 163 sessions, 161 users, 0.00% yahoo / organic — 141 sessions, 128 users, 1.42% Google Organic dominates with about 57% of sessions, followed by Direct at roughly 33%. Blank or broken source/medium rows were excluded because their attribution and conversion rates are unreliable.
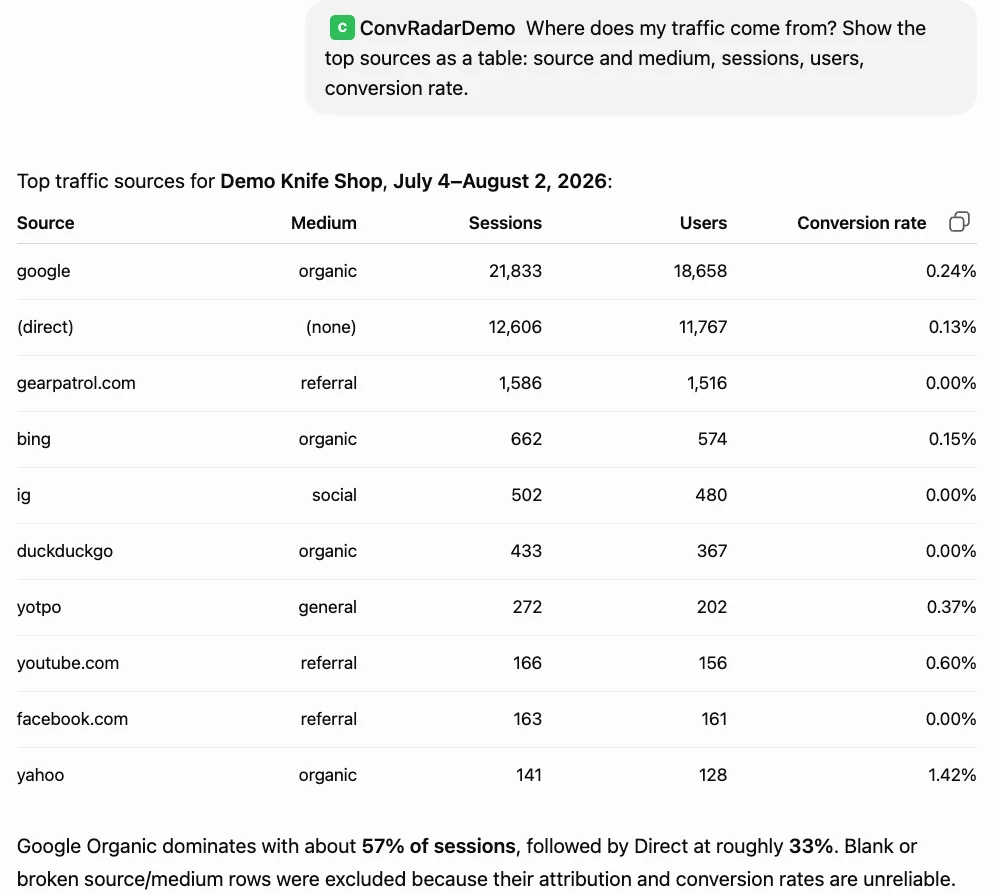
ChatGPT · GPT-5.6 Sol · captured 2026-08-03 · Demo Shop, data window 2026-03-28 to 2026-08-02
When to reach for this
Use this to find out where the volume actually is
One table, every channel, ordered by sessions, with conversion rate beside each. It is the cheapest way to answer "which channel is worth optimising" before anyone argues about it, because it puts volume and quality on the same row instead of in two different reports.
Not this one if you want to know why a channel changed
This is a snapshot of the mix as it stands. If a channel appeared, collapsed or doubled and you want to know when and whether it was significant, anomaly detection is the instrument that watches the mix over time rather than photographing it once.
How to read it
Read the two columns together or you will read them wrong
In the run above, google organic carries 21,833 sessions at 0.24% and yahoo carries 141 at 1.42%. Yahoo converts almost six times better and is worth roughly nothing: 141 sessions at 1.42% is two conversions. Volume without quality is a vanity number, quality without volume is a rounding error, and the only useful reading is the product of the two.
A 0.00% row is usually a sample-size story, not a channel story
gearpatrol.com sent 1,586 sessions and converted 0.00%. On this store's baseline of roughly 0.2%, the expected number of conversions from 1,586 sessions is about three, so zero is entirely ordinary noise rather than evidence that the referral is worthless. Before you cut a channel on a 0.00%, check whether it ever had enough traffic to show a conversion at all.
Direct at a third of sessions is a measurement finding
Direct sits at roughly 33% of sessions here. Some of that is real, people typing the name in, and a lot of it is attribution loss: stripped UTM parameters, app webviews, redirects that dropped the referrer, email clients hiding the source. A direct share that size means part of your acquisition reporting is describing a bucket rather than a channel, and that is worth fixing before you reallocate budget on the numbers around it.
It says out loud what it excluded
The answer ends with a line about dropping blank or broken source and medium rows because their attribution is unreliable. That sentence is part of the result. A channel table that silently swallows its unattributable rows will not add up to your session total, and you will spend an afternoon working out why.
Limits
- It reports the mix as your property recorded it. Bad or missing UTM tagging shows up here as Direct, and no tool can recover a source that was never captured.
- The conversion rate per channel is a raw rate, not a significance test. Two channels a few tenths of a percent apart on small volume are not distinguishable, and this instrument does not pretend otherwise.
- Attribution is whatever model your GA4 property is configured with. This reads that configuration; it does not re-attribute anything.
- It is a snapshot over the window, not a trend. A channel that grew steadily and one that spiked and died can produce the same row.
Related instruments
Go deeper
Try it on your own data
Every instrument runs on your own GA4, read-only, inside Claude or ChatGPT. One connector covers all of them.
Add the connector →Session captured 2026-08-03 against the ConvRadar demo property. Masked in the image: cropped to the conversation column, so the account sidebar and workspace name are out of frame, no connector URL is in frame, so no token can leak, no account email or avatar is in frame.