Docs / Full conversion audit
What runs when you ask for a full conversion audit
One prompt, one call: headline KPIs against the prior period, the biggest funnel leak, anomalies with significance testing, and ranked findings matched to the hypothesis library.
Signature
cr_full_auditThe whole diagnostic in one call: KPIs against the prior period, the biggest funnel leak, anomalies, and ranked findings.cr_get_current_stateWhat is already in flight for this account: the last 30-day overview and the active hypotheses.
What you ask
- Run a full conversion audit of my property. Give me the headline KPIs against the prior period, the biggest funnel leak, any anomalies, and the ranked findings with what you would fix first.
What runs
What comes back
Run a full conversion audit of my property. Give me the headline KPIs against the prior period, the biggest funnel leak, any anomalies, and the ranked findings with what you would fix first.
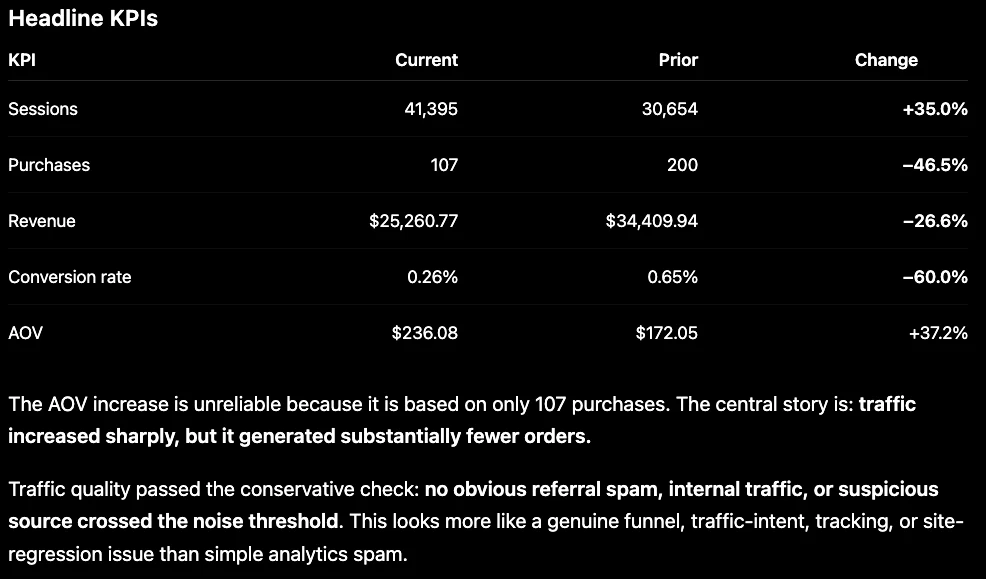
Full conversion audit. Period: July 4 to August 2, 2026 against June 4 to July 3, 2026. Headline KPIs — Sessions 41,395 against 30,654, +35.0%. Purchases 107 against 200, −46.5%. Revenue $25,260.77 against $34,409.94, −26.6%. Conversion rate 0.26% against 0.65%, −60.0%. AOV $236.08 against $172.05, +37.2%. The AOV increase is unreliable because it is based on only 107 purchases. The central story is: traffic increased sharply, but it generated substantially fewer orders. Traffic quality passed the conservative check, so this looks like a genuine funnel, traffic-intent, tracking or site-regression issue rather than analytics spam. Biggest funnel leak: product view to add to cart. 42,879 view_item events, 97.99% drop-off, only about 2.0% proceeded. Before redesigning anything, confirm add_to_cart is firing correctly, test the flow on desktop and mobile, and check variant selection, stock states and disabled buttons. One landing page received 8,160 sessions and produced 3 purchases at a 42.5% engagement rate. Anomalies: six detected, including three severe traffic spikes. July 19 sessions +137.6%, July 27 +176.2%, July 28 +230.5%, July 17 purchases +145% and conversion rate +130%, July 7 sessions −8.5%. The late-July surges did not translate into proportional purchases. No site, campaign or tracking changes have been logged in the change diary, so the anomalies cannot currently be tied to a known deployment. Ranked findings. First, product pages are failing before add to cart: 98% drop-off across 42,879 item views, and it sits near the top of the commercial funnel so it affects everything downstream. Second, the collapse affects core segments rather than a niche: desktop −77.1%, direct −73.9%, United States −58.8%, with desktop about 30% of sessions, direct about 33% and the US about 77%. Third, product discovery is weak: the homepage produced 39 purchases from 12,979 sessions, and the view-all page produced zero from 1,577 at a 21.2% engagement rate. Fourth, the traffic spikes need source-level investigation. Fifth, conversion at 0.26% sits about 88% below the ecommerce median benchmark of roughly 2.2%. Recommended order: verify add_to_cart tracking and inspect the top product pages, reproduce the desktop and direct journey through checkout, investigate the July spikes, improve category navigation, then ship the verified changes and log them so their impact can be measured after 14 days.
ChatGPT · GPT-5.6 Sol · captured 2026-08-03 · Demo Shop, data window 2026-03-28 to 2026-08-02
When to reach for this
Use this as the first thing you ever ask
One prompt, and it decides what to look at. It reads headline KPIs against the prior period, walks the funnel, scans for anomalies, checks traffic quality, compares against a benchmark and reads the change diary, then ranks what it found. On a property you have never opened it saves you from guessing which question to ask first.
Use it again when too much has changed at once
When several numbers moved and you cannot tell which is cause and which is symptom, the audit is the instrument that puts them in one frame and orders them. Every other instrument answers a narrower question you already knew to ask.
Not this one when you already have a suspect
If you know the step, the segment or the product, the dedicated instrument is faster and goes deeper. The audit is breadth; funnel leak diagnosis, segment comparison and product analysis are depth.
How to read it
The order of the findings is the actual output
Five findings come back ranked, and the ranking is doing more work than any single number. Product pages come first not because 98% is the biggest percentage on the page but because that step sits near the top of the funnel, so everything downstream inherits the loss. A list of five true observations in the wrong order is worth much less than the same five ordered by leverage.
Watch it argue against its own numbers
AOV is up 37.2%, and the line directly under the table says that figure is unreliable because it rests on 107 purchases. That is the audit doing the thing a dashboard cannot: a dashboard shows the green arrow, this one tells you not to trust it. The same instinct shows up in the funnel section, which tells you to verify that add_to_cart is firing before redesigning anything.
Traffic up and conversion down is one story, not two
Sessions +35.0% and purchases −46.5% in the same window is almost never two independent events. It is usually acquisition mix: more people arrived, and they were not the same kind of people. The audit says so and then declines to prove it, which is correct, because proving it needs the source-level split it recommends as the fourth action.
An empty change diary is a finding too
The audit checks the diary and reports that nothing was logged, so the anomalies cannot be tied to a deployment. That single line is the argument for the change diary as a habit: the same audit run against a property with a populated diary can say "the July 19 spike starts the day after you shipped the new homepage" instead of listing dates and shrugging.
Limits
- It is breadth, not depth. Each finding is a lead with evidence attached, and every one of them ends with a verification step you still have to perform.
- It reads analytics only. It never opens your pages, so it can say a step leaks and not why. Pair it with visual proof or a page check for that.
- It correlates; it does not prove cause. The audit is explicit about this when it declines to blame the traffic spikes without a source-level split.
- The run above took about three and a half minutes. Several tools fire in sequence and a client that streams its thinking will show that as a long pause.
- Benchmarks are directional bands for a vertical, not a target for your business.
Related instruments
Go deeper
Try it on your own data
Every instrument runs on your own GA4, read-only, inside Claude or ChatGPT. One connector covers all of them.
Add the connector →Session captured 2026-08-03 against the ConvRadar demo property. Masked in the image: cropped to the conversation column, so the account sidebar and workspace name are out of frame, no connector URL is in frame, so no token can leak, no account email or avatar is in frame.