Docs / Anomaly detection
What runs when you ask why a number moved
Scans daily metrics for statistically significant spikes and drops, then checks whether the traffic mix behind them changed.
Signature
cr_find_conversion_anomaliesStatistically significant spikes and drops in your daily metrics over the last N days.cr_detect_traffic_quality_changeStep changes in traffic mix and per-source sessions, so a metric move can be traced to who arrived.cr_assess_traffic_qualityScores how much of the traffic looks like noise: referral spam, internal and test traffic.
What you ask
- Did anything move significantly in the last 30 days? Show the anomalies as a table with the date, the metric, the size of the move and whether it is statistically significant.
What runs
What comes back
Did anything move significantly in the last 30 days? Show the anomalies as a table with the date, the metric, the size of the move and whether it is statistically significant.
Yes — ConvRadar found 6 statistically significant anomalies in the latest available 30-day window, July 4 to August 2, 2026. Jul 7 — Sessions — −8.5%, 1,006 baseline to 921 — Yes, notable, z = −3.00 Jul 17 — Purchases — +145.0%, 2.86 baseline to 7 — Yes, notable, z = 2.92 Jul 17 — Conversion rate — +130.0%, 0.30% to 0.69% — Yes, notable, z = 2.55 Jul 19 — Sessions — +137.6%, 968 baseline to 2,300 — Yes, severe, z = 12.04 Jul 27 — Sessions — +176.2%, 1,061 baseline to 2,929 — Yes, severe, z = 6.07 Jul 28 — Sessions — +230.5%, 1,132 baseline to 3,742 — Yes, severe, z = 5.25 The biggest movement was the July 28 traffic spike. There were no statistically significant revenue anomalies during this period.
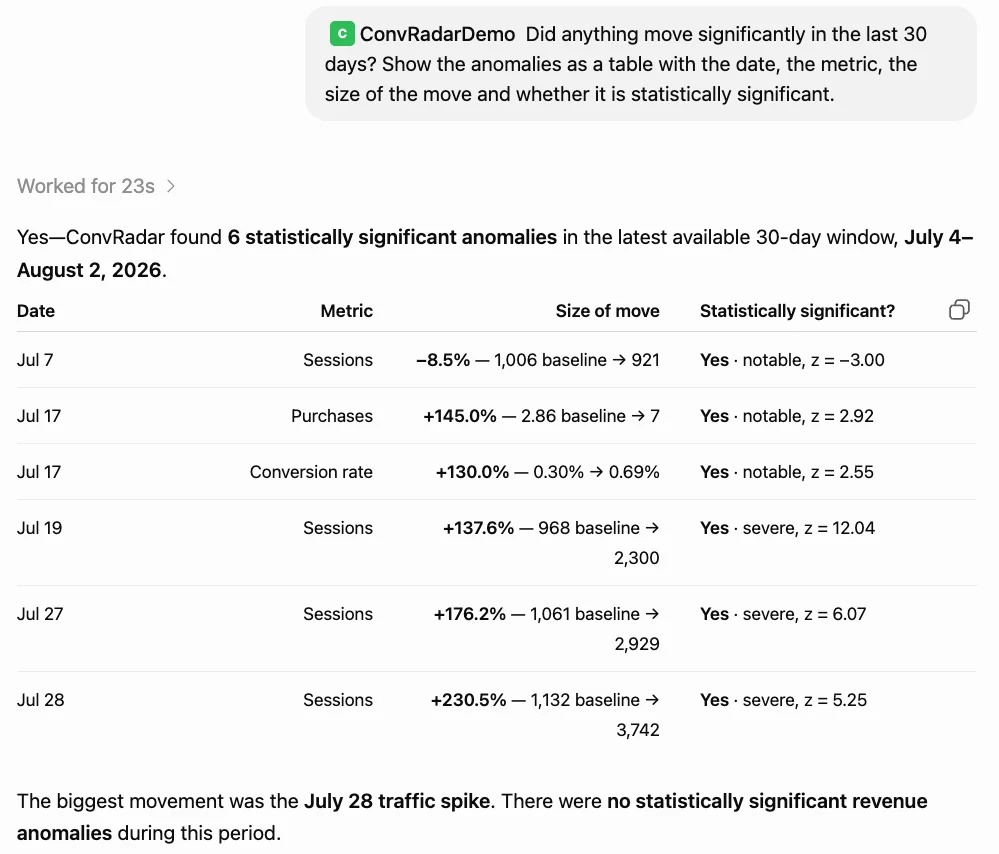
ChatGPT · GPT-5.6 Sol · captured 2026-08-03 · Demo Shop, data window 2026-03-28 to 2026-08-02
When to reach for this
Use this when a number moved and nobody knows why
This is the instrument for "conversion fell last week" or "traffic doubled on Tuesday". It scans daily metrics against their own recent baseline and returns only the moves large enough to be improbable, so you get a dated list of events instead of a chart to squint at.
Not this one for a steady, long-standing problem
An anomaly is a break from your own baseline. A store that has always converted badly has no anomaly to find: the bad number is the baseline. When nothing broke and the level is simply low, funnel leak diagnosis is the right instrument.
Run it before you run anything else after a surprise
It also scores traffic quality and the traffic mix, so it separates "something changed in the business" from "something changed in the tracking". Doing that first stops you diagnosing a funnel that was never broken.
How to read it
Read the z-score, not the percentage
The percentage tells you how big the move looked. The z-score tells you how surprising it was given how noisy that metric normally is. Jul 19 sessions moved +137.6% at z = 12.04 and Jul 17 purchases moved +145.0% at z = 2.92: almost the same headline percentage, wildly different confidence. Sessions are a high-volume metric where a swing that size is essentially impossible by chance; purchases are low-volume, so the same relative jump is only just past the line.
A +145% purchase spike of 2.86 to 7 is seven purchases
The baseline is 2.86 purchases a day and the anomalous day had 7. That is a real, flagged, statistically significant event, and it is also four extra sales. Low-volume metrics produce enormous percentages from tiny absolute numbers, so always read the raw pair beside the percentage before anyone builds a plan on it.
Four session spikes in twelve days is a pattern, not four events
Jul 19, Jul 27 and Jul 28 are all severe session spikes, and Jul 28 tripled the baseline. Repeated spikes of that shape usually have one cause: a campaign launch, a press hit, a bot wave, or a tracking change that started double-counting. Treat the cluster as one question rather than opening three investigations.
The absence of a revenue anomaly is a finding
Sessions spiked hard three times and revenue never moved enough to flag. That combination says the extra traffic did not buy anything, which points at traffic quality or a mismatched audience rather than at a page problem. A silent row is doing work here.
Limits
- It needs enough daily history to establish a baseline. A property connected last week has nothing to compare against and will return nothing.
- Low-volume metrics like purchases on a small store will rarely clear significance, so real changes there can pass unflagged. That is the correct behaviour, not a miss.
- It detects that something moved and when. It does not know why: a campaign, a bot wave and a tracking change all look the same from the metric alone.
- The window is the last N days against the preceding baseline. A slow drift over months never breaks the threshold on any single day and will not appear.
Related instruments
Go deeper
Try it on your own data
Every instrument runs on your own GA4, read-only, inside Claude or ChatGPT. One connector covers all of them.
Add the connector →Session captured 2026-08-03 against the ConvRadar demo property. Masked in the image: cropped to the conversation column, so the account sidebar and workspace name are out of frame, no connector URL is in frame, so no token can leak, no account email or avatar is in frame.