Docs / Product analysis
What runs when you ask which products underperform
Every SKU classified as underperforming, watchlist, healthy or no-purchase, with per-item view, cart and purchase rates.
Signature
cr_get_product_analysisEvery SKU pre-classified as underperforming, watchlist, healthy or no-purchase.cr_get_product_performanceTop products by revenue, views or purchases, with cart-to-view and purchase-to-view rates per item.
What you ask
- Which of my products are underperforming? Show them as a table with views, add-to-carts, purchases and revenue, and say what makes each one underperforming.
What runs
What comes back
Which of my products are underperforming? Show them as a table with views, add-to-carts, purchases and revenue, and say what makes each one underperforming.
For July 4 to 31, 2026, ConvRadar classified 16 of 87 SKUs as underperforming. The 8 highest-priority ones: 203 — 1,920 views, 50 add-to-carts, 1 purchase, $304. Checkout to purchase is 72% below category median. 512 — 2,007 views, 11 add-to-carts, 2 purchases, $656. View to cart rate is 91% below category median. 0556BLK — 1,829 views, 8 add-to-carts, 2 purchases, $768. View to cart rate is 93% below category median. 117 — 2,324 views, 46 add-to-carts, 6 purchases, $1,440. View to cart rate is 68% below category median. 0450CF — 1,255 views, 28 add-to-carts, 4 purchases, $944. Checkout to purchase is 45% below category median. 556 — 1,388 views, 10 add-to-carts, 5 purchases, $1,840. View to cart rate is 88% below category median. 4 — 1,121 views, 70 add-to-carts, 2 purchases, $576. Cart to checkout is 66% below category median. 357 — 1,158 views, 47 add-to-carts, 4 purchases, $784. Cart to checkout is 62% below category median. The biggest pattern is poor product-page-to-cart performance: 10 of the 16 underperforming SKUs have their main bottleneck at view to add to cart. ConvRadar estimates roughly $3,073 in weekly revenue opportunity across all 16 underperformers, although confidence is currently low because most individual products have fewer than ten purchases. Traffic quality looks clean, with 0% estimated analytics noise, so these gaps probably aren't being caused by spam or test traffic. The diagnosis identifies where each product loses users; it does not yet prove the specific page-level cause, such as pricing, stock availability, weak imagery, or unclear variants.
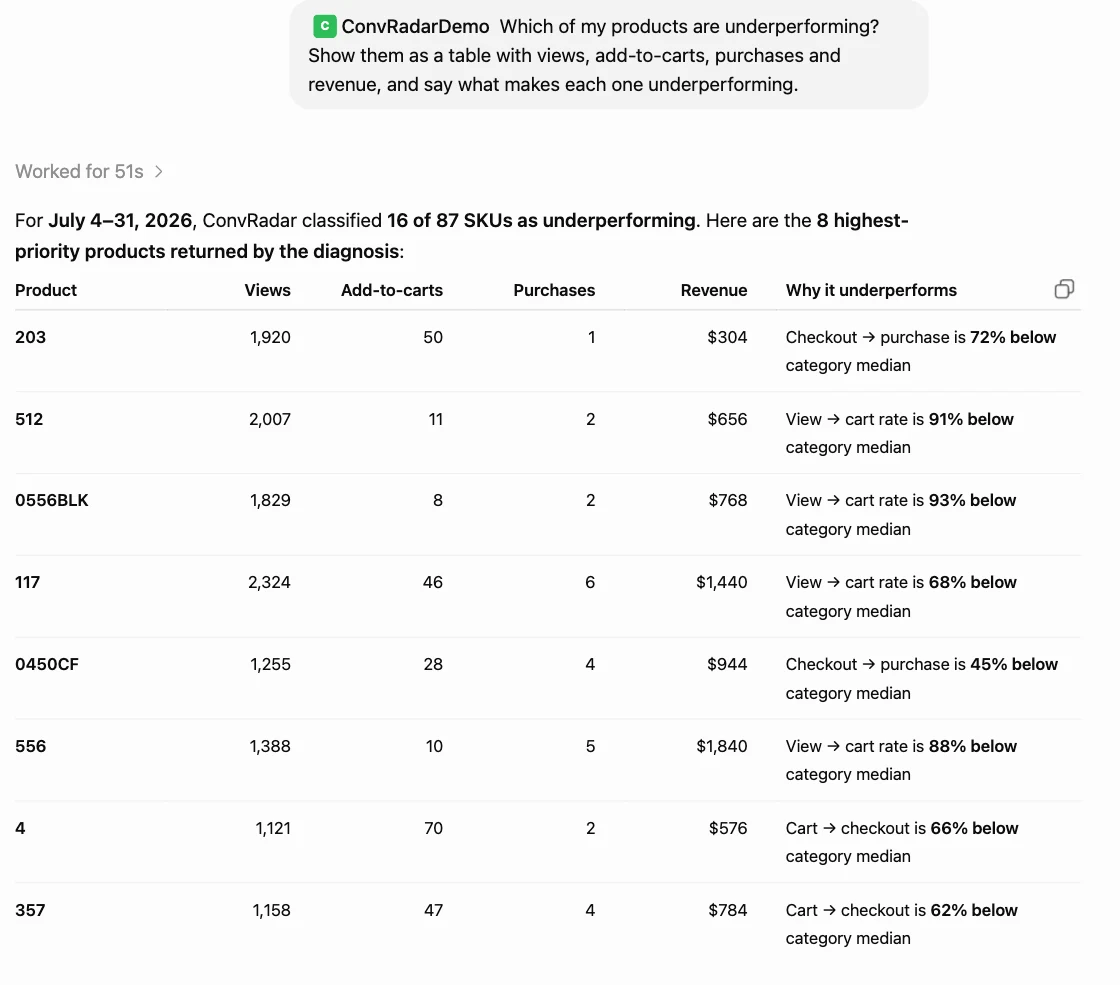
ChatGPT · GPT-5.6 Sol · captured 2026-08-03 · Demo Shop, data window 2026-03-28 to 2026-08-02
When to reach for this
Use this when the funnel is fine on average and money is still missing
A store-wide funnel read averages every SKU together, so a handful of badly performing products hide inside a respectable overall number. This one classifies every SKU against its own category median and returns the ones that are genuinely out of line, with the step each one fails at.
Not this one if the whole store dropped
Per-product diagnosis is for a persistent structural problem. If conversion fell across the board last week, you are looking for an event, not a catalogue: anomaly detection finds when it broke, and funnel leak diagnosis finds which step absorbed it.
How to read it
"Below category median" is the whole idea
Nothing here is judged against an absolute target. SKU 0556BLK is flagged because its view-to-cart rate is 93% below the median for its own category, not because 8 add-to-carts is a small number. That is what makes the list actionable: a low-traffic accessory and a hero product are each measured against their own peers, so the answer is not simply a list of your least popular items.
The failing step tells you which team to send it to
The run above splits into three failure modes and they have nothing to do with each other. View to cart failing (512, 0556BLK, 117, 556) is a product page problem: imagery, price, variants, stock. Cart to checkout failing (4, 357) is a cart or shipping-cost problem. Checkout to purchase failing (203, 0450CF) is a payment or form problem. Ten of the sixteen sat in the first bucket, which is a single fix pattern rather than sixteen separate investigations.
Read the confidence caveat before you read the money
The answer estimates about $3,073 a week across all sixteen and immediately says confidence is low because most of these SKUs have fewer than ten purchases. That is the honest reading: with one or two purchases per product, a per-SKU rate is barely a measurement. Treat the ranking as a shortlist to look at, and the revenue figure as an order of magnitude rather than a forecast.
Look at the ratio, not the row
SKU 4 has 70 add-to-carts from 1,121 views, which is a strong product page, and then 2 purchases. SKU 512 has 11 add-to-carts from 2,007 views. Both appear on the same list and they are opposite problems: one converts interest and loses the sale, the other never creates the interest. Reading the table left to right and watching where the number collapses is faster than reading the explanation column.
Limits
- It needs item-scoped ecommerce events. A store that does not send view_item, add_to_cart and purchase per SKU cannot be diagnosed this way at all.
- Per-product volumes are small by nature, so most rows carry low statistical confidence. The run says so out loud rather than hiding it, and the ranking should be read as a shortlist rather than a verdict.
- It identifies the step where a product loses people. It does not prove the cause: price, stock, imagery and unclear variants all look the same from the event stream.
- The comparison is to the category median inside your own catalogue, not to an industry benchmark. A whole category that underperforms will not stand out here.
Related instruments
Go deeper
Try it on your own data
Every instrument runs on your own GA4, read-only, inside Claude or ChatGPT. One connector covers all of them.
Add the connector →Session captured 2026-08-03 against the ConvRadar demo property. Masked in the image: cropped to the conversation column, so the account sidebar and workspace name are out of frame, no connector URL is in frame, so no token can leak, no account email or avatar is in frame, trimmed the scroll chevron overlay from the bottom edge.