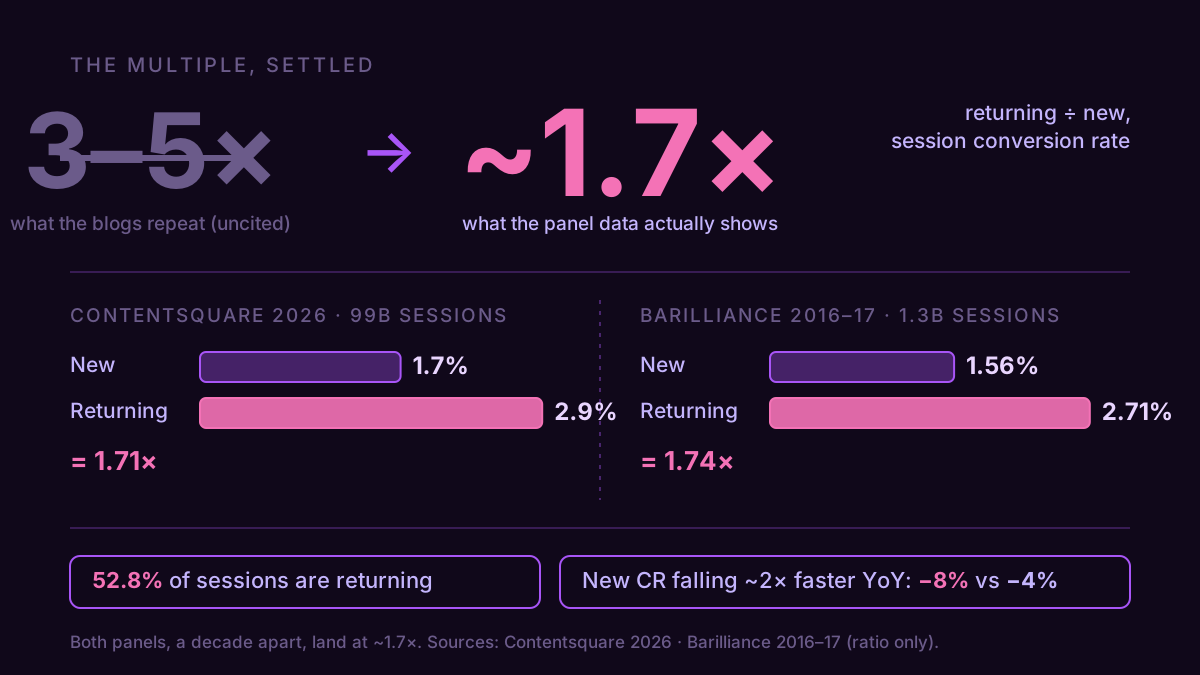
Returning visitors convert about 1.7× better than new ones. Not 3×, not 5× — 1.7×. New sessions land near 1.7%, returning near 2.9%. That's the whole gap, and a good chunk of the CRO internet overstates it by two to three times.
Search the question and you'll be told returning converts three to five times higher: 1% against 5%, that kind of spread. Nobody sources it. And when you chase where it came from, it's quietly measuring a different thing: a returning customer, someone who already bought, against a cold first-timer. Two different populations. In GA4's terms a returning visitor is just one it has seen on this browser before, and a new visitor is a first session; neither has anything to do with whether they've bought. The visitor-level gap, the one GA4 actually puts in front of you, is 1.7×.
The exact multiple matters more than it looks. Believe returning converts 5× better and a low overall conversion rate reads like a broken funnel. Know it's 1.7× and the same number reads like what it usually is: too much cold traffic. The store isn't broken; it's talking to more strangers than it thinks, and strangers convert like strangers.
The multiple two panels agree on
Contentsquare's 2026 benchmark runs on 99 billion sessions across 6,000+ sites. Its split: new visitors convert at 1.7%, returning at 2.9%, a 1.71× gap. Now go back a decade. Barilliance measured 1.3 billion ecommerce sessions over 2016–17 and got 1.56% new against 2.71% returning, a 1.74× gap. One panel spans every kind of site, the other is ecommerce only, and they still land on the same multiple. The myth even cites Barilliance against itself: the study gets quoted under the 3–5× claim, yet its own rate table works out to returning buying about 74% more, a 1.74× gap. Even that source reports 1.7×, not 3.
| Panel | New | Returning | Gap |
|---|---|---|---|
| Contentsquare 2026 · 99B sessions, 6,000+ sites | 1.7% | 2.9% | 1.71× |
| Barilliance 2016–17 · 1.3B ecommerce sessions | 1.56% | 2.71% | 1.74× |
That's the tell. Matched datasets landing together prove less than mismatched ones with no reason to agree, and these two share neither scope nor decade. Contentsquare is the one panel publishing a 2026 split this size, so read its figures as today's levels and Barilliance as corroboration of the multiple, not the levels. The 1.7% and 2.9% lines are cross-site averages, so your own vertical may sit a little higher or lower — but the ~1.7× spread between your two cohorts is the part that travels.
So where do the 3–5× figures come from? Almost always the same swap. They quote a returning-customer rate against a new-visitor rate and call it new-vs-returning. The giveaway is the denominator: the 4×-plus numbers almost always trace back to subscription-box or loyalty datasets, where "returning" means someone who has already bought, not someone who has merely been to the site before. Of course a repeat customer converts far more than 2.9% — that's a different denominator and a different human. The honest base rate to measure against is the one in the ecommerce conversion rate bands, not a loyalty stat wearing a visitor label.
Why returning converts higher, and why it stops at 1.7×
The gap itself isn't a mystery. A returning visitor has already cleared the trust barrier, learned what shipping costs, and knows the checkout won't ambush them. A fair share came back specifically to buy. A first-timer is doing all of that at once, on a page that has a few seconds to earn it. That's a real edge, and it's exactly why returning converts better. It's also why the gap stops at 1.7× and not 5×: the friction a returning visitor has already removed is real but finite. Familiarity buys you a better conversion rate, not a different order of magnitude.
A low blended rate is usually a traffic problem, not a checkout problem
Returning visits are now 52.8% of all sessions, the majority, per Contentsquare. So your blended conversion rate is a weighted average of two cohorts, with the weight sitting on the warmer one. Push the mix toward new — a burst of cold paid traffic, a post that pops off, an AI assistant sending strangers — and the blended number sinks even though nothing on the site changed. That's the trap: the rate can fall while every cohort holds steady, purely because the mix moved.
And new is the cohort quietly getting worse. Both fell year over year in Contentsquare's 2026 read, but new-visitor conversion dropped twice as fast: −8% against −4%. First impressions are the soft spot, and they're softening. So a blended rate that slid last quarter is two stories in one number: a real UX regression, or just more cold traffic than usual. The blend can't separate them. Only the split can.
What this looks like on a store
Take a store — call it Northlight. The owner opens GA4, sees a blended session conversion rate of 1.5%, and concludes checkout is broken. Then they split by cohort over the last 90 days.
| Cohort | Share of sessions | Conversion rate |
|---|---|---|
| New | 75% | 1.0% |
| Returning | 25% | 2.9% |
| Blended | 100% | 1.5% |
The blend checks out: 0.75 × 1.0% + 0.25 × 2.9% = 1.48%. Now read each cohort against its own base rate instead of the average. Returning sits at 2.9%, right on the cross-site returning line; whatever people feared about checkout, that cohort sails through it fine, which kills the broken-funnel theory. New is 1.0% against a 1.7% new-visitor line, about 40% low. And the store's own spread gives it away without needing your vertical's absolute band: returning converts 2.9× new here, well past the healthy ~1.7×, so new is the laggard, not the checkout. The mix makes it worse, 75% new where the norm is closer to 47%, so the traffic itself runs colder than average and drags the blend down.
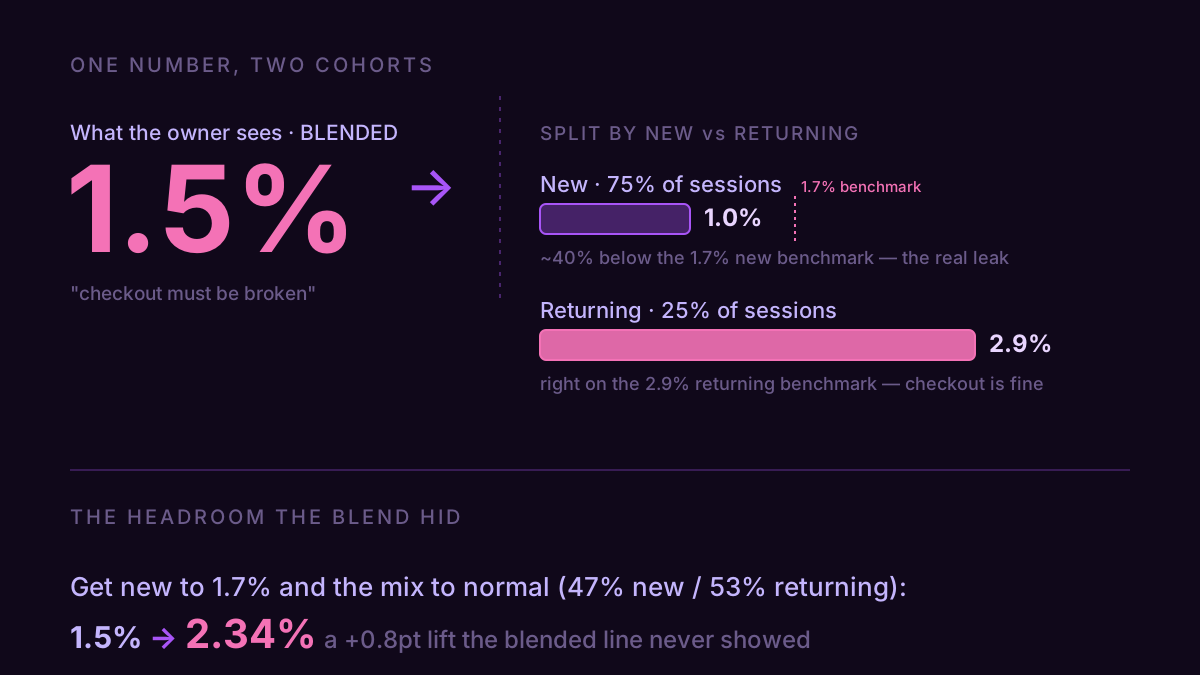
Two leaks, neither in checkout: a weak new-visitor first impression and an over-cold traffic mix. Tighten the message-match so first-timers land on what the ad promised, warm the mix up with retargeting and email, and leave the checkout alone. The headroom the blended line was hiding: get new to benchmark and the mix to normal, and you're at 0.47 × 1.7% + 0.53 × 2.9% = 2.34%. That's a 0.8-point lift that never showed up on the number the owner was staring at. Some of that is a near-term page fix on the new-visitor rate; the rest is slower work, warming the mix with retargeting and email. The two overlap, so don't bank on the full 0.8 points landing at once, or landing fast. It's the same segment-before-you-judge move that rescues a "bad" mobile rate, different axis, identical logic. For the first-impression half, a Voice of Customer run shows which of the pains customers rank first your landing page never mentions.
How GA4 lies to you here — in your favour
One catch, and it runs the opposite way to what you'd guess: GA4 understates this gap. Safari's cookie cap, incognito, cleared cookies, a new device, a re-shown consent banner — each mints a fresh ID for a person who's actually been here before. So a slice of genuinely-returning visitors, who convert better, get dumped into the "new" bucket. That inflates the new share and lifts the apparent new rate, which flattens the gap. GA4's new-vs-returning is directionally right and quantitatively soft.
So use GA4's split to find which cohort is weak, then set the pass/fail line from a panel source: new around 1.7%, returning around 2.9%. The split has two more soft spots. The Data API has no native "returning users" metric, so tools back into it as Total − New, which drifts on longer date ranges. And the standard New/returning report parks a chunk of sessions in a (not set) bucket that quietly falls out of the ratio. None of it is fatal. It just means the split is a compass, not a ruler.
Splitting your own traffic
By hand it's quick. In GA4, open Explore, start a blank exploration, and pull New / returning in as a dimension against Session conversion rate (add Session source / medium as a second breakdown if you want to see which channels bring the cold crowd). Ignore the (not set) row that shows up — it's the untagged bucket from earlier, and its share will muddy the split if you leave it in. Read each row against its own base rate — that's the whole discipline, and the part most people skip is doing it every month instead of once. None of this is retail-only: run the same split on a signup, a booking, or a lead form, and swap "checkout" for whatever your conversion is.
The faster version skips the exploration. Connect GA4 to the AI client you already have open and ask it straight: "split my conversion rate by new versus returning for the last 90 days, and tell me if new is below the 1.7% benchmark or if it's just the traffic mix." It comes back in plain English against your real sessions. It's also the honest way to read the AI referral traffic everyone's watching right now: that traffic is almost entirely new visitors, so it looks like it converts worse mostly because of the mix, not the source.
A 1.5% store isn't a broken store or a healthy one. It's two cohorts averaged into a number that describes neither — and the average will keep pointing you at the checkout while the leak sits at the front door.