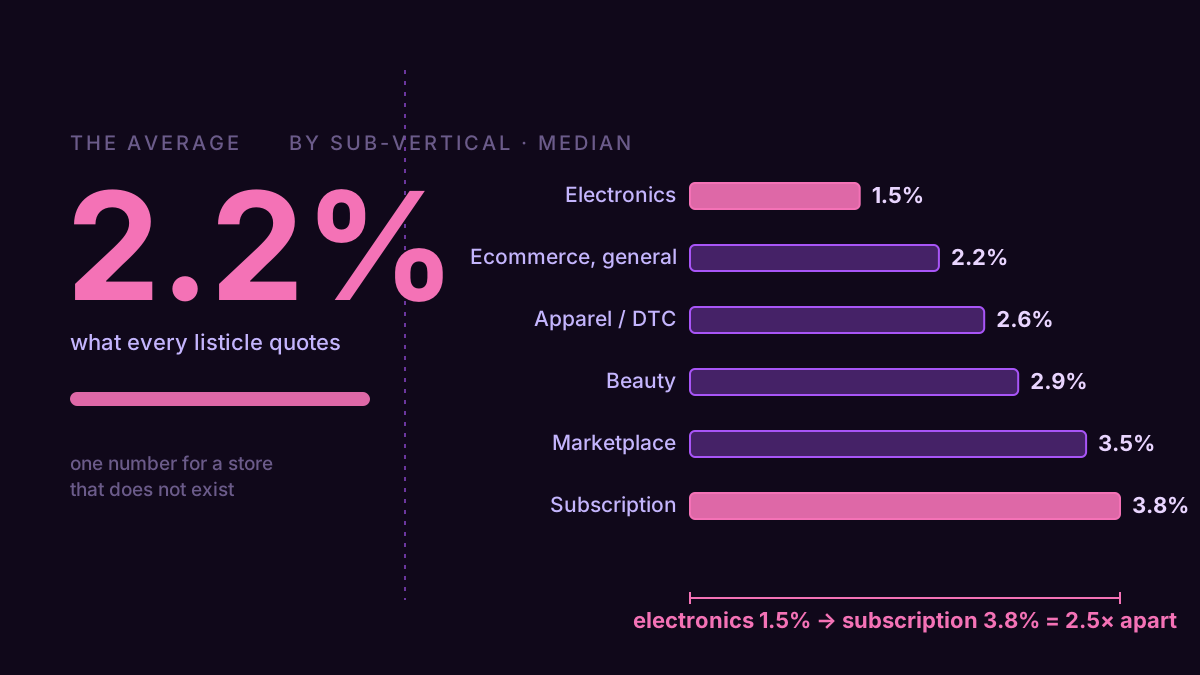
Median ecommerce conversion rate is about 2.2% — true, and useless to you. Electronics runs near 1.5%, apparel 2.6%, beauty 2.9%, subscription and marketplace closer to 3.5–3.8%. That's a 2.5x spread hiding inside one word. Compare your store to "the average" and, depending on what you sell, you'll either panic over a healthy number or relax about a broken one.
Every "ecommerce conversion benchmark" post does the same thing: one number per industry, in a table, and the numbers don't even agree with each other. Ask three of them what beauty converts at and you get 2.5%, 3%, and "3–4%." Dynamic Yield puts the Americas average at 2.96%; other 2026 roundups land at 1.4%. Nobody's lying — they're measuring different stores over different months and rounding hard. A number that swings 2x between sources isn't a benchmark. It's a rumor with a decimal.
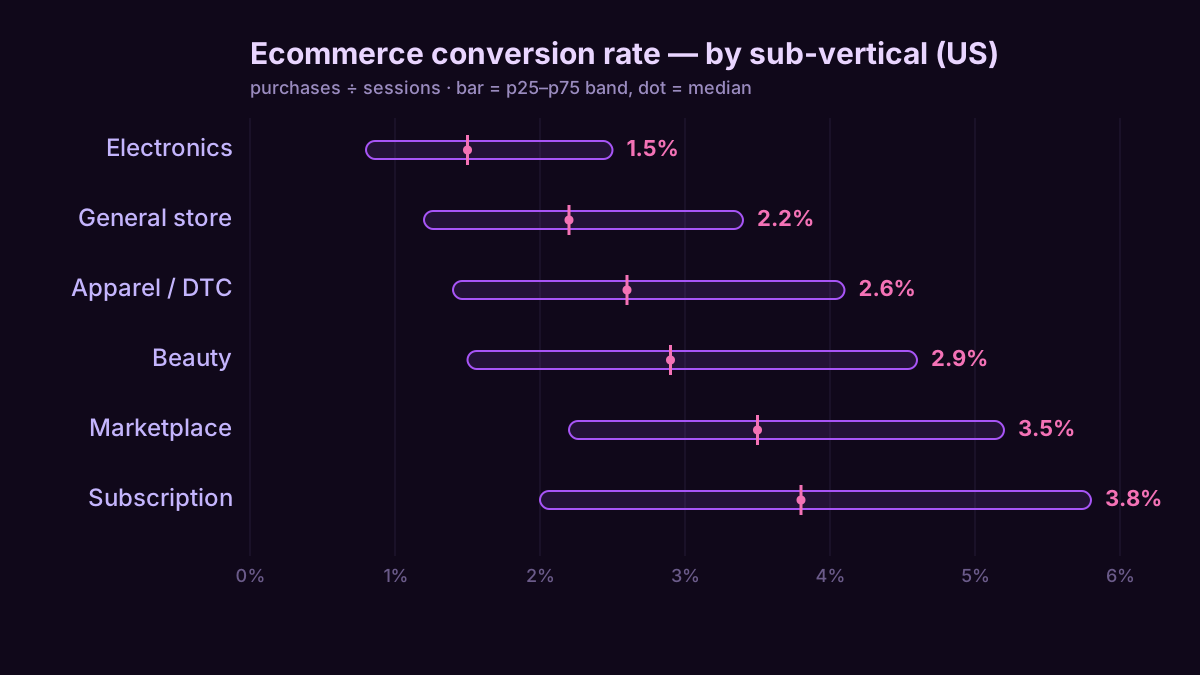
So here's what I use instead: the bands by sub-vertical. Not a single number — the p25-to-p75 range with the median marked. And a note on where they come from, because this is the exact thing the listicles get away with skipping.
The bands, by sub-vertical
These are ConvRadar's calibrated bands. The median on each row is anchored to the public report named. The range around it is ours — modeled from the spread across those reports and our own GA4 sample — because the public reports hand you a median and stop there. The distribution is the part they leave out, and it's the only part that tells you whether your own number is normal or a problem.
Conversion rate here is the honest denominator: purchases ÷ all sessions — the number GA4 gives you, before some platforms swap in a "shoppers who reached checkout" base to flatter it. Read the range, then find your dot inside it. And "good" isn't beating 2% — good is sitting in the upper half of your own row.
| Sub-vertical | p25 | Median | p75 | Median anchored to |
|---|---|---|---|---|
| Electronics | 0.8% | 1.5% | 2.5% | Statista + Adobe 2024 |
| Ecommerce, general | 1.2% | 2.2% | 3.4% | Littledata + IRP Commerce 2024 |
| Apparel / DTC | 1.4% | 2.6% | 4.1% | Klaviyo DTC 2024 |
| Beauty | 1.5% | 2.9% | 4.6% | Klaviyo Beauty 2024 |
| Marketplace | 2.2% | 3.5% | 5.2% | Marketplace composite 2024 |
| Subscription | 2.0% | 3.8% | 5.8% | Recharge 2024 |
Not on the list? Map to the nearest behavior, not the nearest label: supplements and anything auto-replenished sit with subscription; jewelry and accessories with apparel; pet, home and general goods on the general row; anything research-heavy and high-ticket with electronics. The live bands for your exact vertical go finer than six rows.
One more thing worth trusting: the public 2026 roundups I checked land in the same order — beauty high, electronics low, apparel between — even while they argue about the decimals. Independent datasets that disagree on the decimals but rank the verticals the same way are telling you the order is real.
Why the sub-vertical beats the average
Look at the two ends. Electronics converts at 1.5%, subscription at 3.8%, and neither store is broken.
Electronics is a research purchase. Someone buying an $800 laptop opens six tabs, compares RAM and warranty, sleeps on it, and comes back three days later on a different device. Most of those sessions are homework, so the rate per session is low by design — and it comes paired with a fat order value, north of $200 median against roughly $58 for subscription. Subscription and marketplace are the mirror image: cheap, low-effort, mostly repeat buyers who already trust you, so far more sessions end in an order.
That's the whole case against the flat average. A 1.6% rate is a quiet alarm for a beauty store and an ordinary Tuesday for an electronics one. The number means nothing until you know which line of the table you're standing on — and the "all ecommerce" median at 2.2% is the one line nobody actually operates.
The denominator trap
The fastest way to lie to yourself with a benchmark is to compare two rates measured over different things.
Your Shopify dashboard and your GA4 property will quote you two different conversion rates for the same week, sometimes a full point apart. Most stores I open are benchmarking the Shopify figure against a GA4-based table without noticing the two don't share a denominator. Shopify counts sessions its own way and often reports converted sessions against a narrower base; GA4 counts purchases over all sessions, bots and misfires included, unless you've cleaned it up. Neither is wrong. They're measuring different denominators — so if you check your Shopify number against a GA4-based band, you're comparing a rumor to a rumor. Pick one source and know exactly what's in its denominator.
Two more splits hide inside the blended number. Device: desktop still converts around 3.2–3.9%, mobile 2–3.5%, so a store that's 70% mobile traffic reads "below average" on a blended basis while being perfectly normal for its mix. And source: a session off your abandoned-cart email and a session off cold display are not the same 2.2%, and averaging them describes neither. Blended is where problems go to hide.
A worked example
An apparel DTC store, 41,000 sessions last month, 860 orders. Blended conversion rate: 2.1%.
Against the "all ecommerce" median of 2.2%, that reads as bang-average — nothing to see here. Against the row that actually applies, apparel at 2.6%, it's a different store: 2.1% sits around the p40 of its real peers, below the middle of the pack.
Now split it and the leak gets an address. Desktop converts at 3.6% — top half for apparel, fine. Mobile, which is 68% of the traffic, converts at 1.4% — that's the apparel p25, dead bottom quartile. The store doesn't have a "below average conversion rate." It has a mobile funnel bleeding money while a healthy desktop number hides it in the blend, and the fix is a conversion-drop diagnostic on the mobile path, not a site-wide panic.
Finding your own line without the spreadsheet
You can do this by hand, and it's worth knowing how. In GA4: Reports → Monetisation → Ecommerce purchases for the numerator, Reports → Acquisition → Traffic acquisition for sessions, and the ratio is your blended rate. Then rebuild it in Explore with Device category and Session source / medium as breakdowns, so the rate collapses in front of you at the segment that's leaking. Keep the sub-vertical band in a doc and redo it monthly. It works — it's also an afternoon a month, and keeping the segment math honest is exactly the fiddly part people quietly stop doing.
The faster version puts GA4 inside the AI client you already have open. Connect it and the comparison becomes a question — "is my apparel rate below the sub-vertical median, and does the drop sit on mobile or one source?" — answered in plain English against your real sessions, denominator and all. Sell software instead of stuff? Different funnel, different bands — start with the SaaS benchmarks.
A store sitting at 2.1% is a healthy apparel shop or a broken one, and the average will never tell you which. The row does.