GA4 adds users to your reports that it never observed, and the notice is a small icon reading "Including estimated user data". Hover it and you get a date: "As of [modeling effective date], Analytics is estimating data that's missing due to factors such as cookie consent." No percentage, no per-row flag, no way to ask which of these sessions were real.
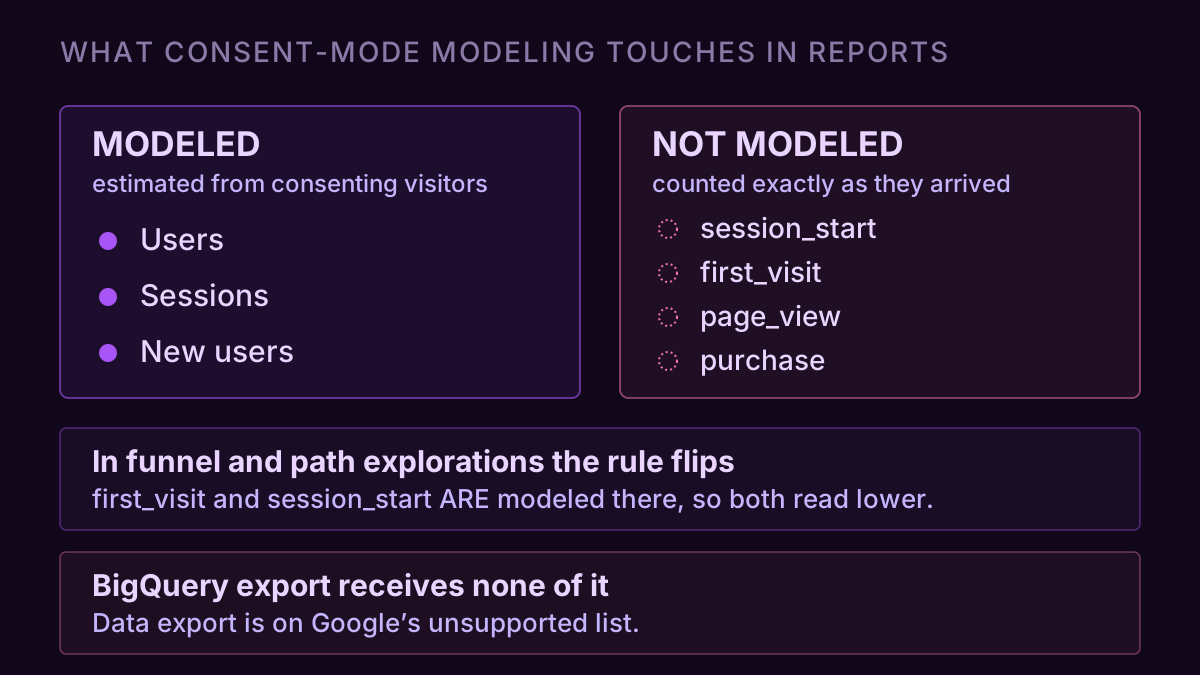
Google's wording: "In reports, modeling is applied to metrics like users, sessions, and new users counts. However, modeling is not applied to event counts such as page_view, first_visit, and session_start." Metrics get the model. Events don't. Then almost every conversion rate anyone computes puts one of each on either side of the divide.
What the model is estimating, and from what
When a visitor declines analytics cookies under consent mode, the tag still fires, but the events arrive with no persistent identifier attached. Google's example: "if Analytics collects 10 page view events, it can't observe and report whether that's 10 users or 1 user." Behavioral modeling closes that hole by learning from the people who did consent on your property and estimating what the rest did.
The training set is local. "The training data used for modeling is based on the observed user data from the property where modeling is activated." So the model carries your own property's consented behavior forward onto its unconsented traffic, which is fine if the two cohorts behave alike and quietly wrong if consent correlates with device or country.
You only see any of it under one reporting identity. Blended resolves a person "by User-ID, device ID, then modeling", Observed stops at the device ID, and Device-based ignores everything else. Blended is the only rung with the model on it, and switching between them "does not affect data collection or processing", which makes the toggle the cheapest diagnostic in GA4.
Search for modeled conversions and half the results describe Google Ads, which runs its own conversion modeling, estimates conversions for clicks it could not observe, and reports them in the Ads interface against the click date. Behavioral modeling is the GA4-side system and it fills in users and sessions rather than conversions. Two models, two interfaces, two date logics, which is one more reason the two platforms disagree about the same week.
Two thresholds decide whether you have it at all
Modeling is not a setting you turn on. The property has to earn it: "at least 1,000 events per day with analytics_storage='denied' for at least 7 days" and "at least 1,000 daily users sending events with analytics_storage='granted' for at least 7 of the previous 28 days". Clear both and "behavioral modeling is automatically enabled when a given property becomes eligible". The icon at the top of a standard report is where you read the outcome: "Including estimated user data" with a date means the model is running, and "Your property doesn't meet the eligibility criteria to use estimated data" means it never started.
Two consequences fall out of that. A small site with a cookie banner will never qualify, so its reports contain consenters only, and the conversion rate it has been tracking all year is a consenting-visitor conversion rate compared against benchmarks built mostly on properties large enough to model. And eligibility is not permanent. Lose it and "estimated data will no longer be available"; regain it and "the estimated data will be available only from the date the property became eligible again", which leaves a hole in the middle of your history that no report will mention.
Metrics are modeled, events are not
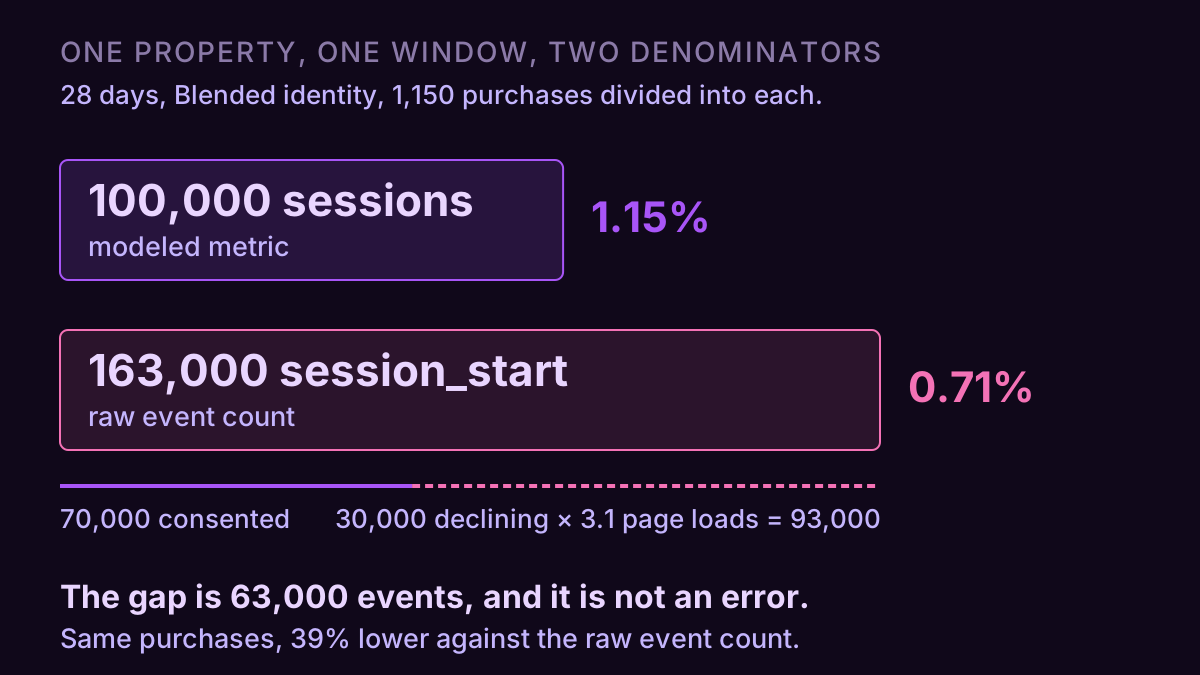
Take a store with a banner, 28 days, Blended identity: reports show 100,000 sessions and 163,000 session_start events. Nothing is broken. 70% of those sessions consented and emitted roughly one session_start each, which is 70,000. The other 30,000 declined, and with no identifier to stitch page loads together, Google's own explanation applies: "the event is sent each time they load a page." At 3.1 page loads per visit that cohort produced 93,000 session_start events on its own.
Now divide 1,150 purchases into each denominator. Against sessions the store converts at 1.15%. Against session_start it converts at 0.71%, 39% lower, same property, same window, both numbers pulled from GA4. One is a modeled metric, the other is a raw event count, and nothing in the interface tells you they are no longer the same population.
The funnel exploration then reports a third number for the same event, and Google says so outright: "In the path or funnel exploration on the other hand, modeling is applied to the first_visit and session_start event... Thus, the first_visit and session_start event count is lower in path and funnel explorations than in reports." Build the funnel in Explore and step one lands near 100,000. Build it from the events table in a report and step one lands near 163,000. Neither view is wrong and they will never agree.
Which way the gap runs is the diagnostic
Sessions and session_start were never going to match exactly, and consent is only one of the forces pulling them apart. A session that opens before midnight and continues after it counts in both days but fires a single session_start, which pushes sessions above the event. Unconsented page loads push the event above sessions. The two run in opposite directions, so the sign of the gap carries information.
Take session_start minus sessions over the same window and read it as a share of sessions. Comfortably positive on a property with a cookie banner and you are looking at the unconsented cohort inflating the event. Near zero or slightly negative and either your consent loss is small or modeling never switched on. What you cannot do is invert the size of the gap into a consent rate, because it also depends on how many pages the declining cohort loads per visit, and that is the one input GA4 will not give you.
Where the modeled rows never reach
The estimated users exist in standard reports and stop there. Google publishes the exclusion list: audiences, user explorer, cohort and user lifetime explorations, segments with a sequence, retention reports, predictive metrics, and "data export, for example, BigQuery export".
A funnel rebuilt in the warehouse and the same funnel in GA4 cannot be reconciled on a consent-mode property, because the warehouse never received the modeled rows and no amount of SQL will reconstruct them. This is a different mechanism from the gap between GA4 and your store admin, and it points the other way: BigQuery is the conservative number here, GA4's reports are the generous one. The Data API is not named on that exclusion list, which is worth ten seconds of checking on your own property rather than assuming in either direction: pull sessions for a fixed window through the API and set it beside the same window in a report under Blended.
Google also publishes no accuracy figure for any of this. The doc goes as far as "estimated user data is compared to a portion of observed user data that was held back from model training" and stops. The 70% number that circulates in blog posts is not from this page. So the model gets the same treatment as every other estimate GA4 hands you: usable, and not something to build a 3% decision on.
What a real diagnosis looked like
Home-goods store, cookie banner live since January, brief was "traffic jumped 18% in March and nobody knows why."
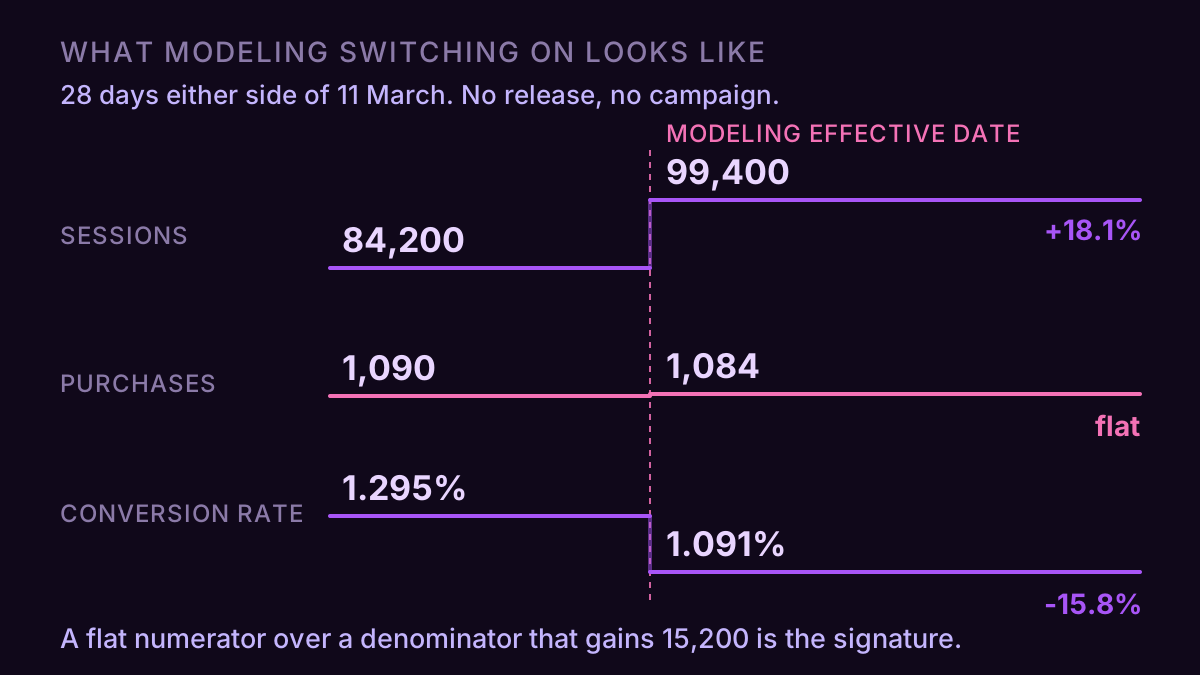
Sessions went 84,200 to 99,400 across the 11 March boundary, up 18.1%. Purchases went 1,090 to 1,084. Conversion rate fell from 1.295% to 1.091%, a 15.8% drop that the team had already started attributing to a checkout release. 15,200 sessions had appeared with no campaign and no new referral behind them, and every one of them refused to buy anything.
That shape is not a traffic event. Purchases are events and events are never modeled, so a numerator that stays flat while the denominator gains is the signature of modeling switching on. The data-quality icon's effective date read 11 March. The property had crossed the 1,000-events-denied threshold in early March and Google enabled the model automatically, exactly as documented.
The confirmation took one click. Reporting identity to Observed, reload, and the step disappears; back to Blended, and it returns. Same trick works on any overnight move you cannot source, and it is the only lever in this whole area that changes nothing permanently.
The check, and the prompt worth keeping
Four checks settle it on any property. The data-quality icon on a standard report, which tells you whether the model is running at all and from what date. Sessions against session_start for the same window, so you know which way your gap runs. The same window under Blended and under Observed, so you know how much of your traffic is estimated. And your funnel's entry step in Explore against the event count in a report, so you know which of the two your dashboards have been dividing by.
That is a tedious afternoon in the interface and about four minutes through a connector. We built ConvRadar as a hosted GA4 MCP server for exactly this kind of question, where the answer is arithmetic across three surfaces rather than a chart. The prompt: "Pull sessions and the session_start event count for the last 28 days. Give me the difference as a share of sessions, then compute conversion rate on both denominators using purchases, and tell me which one my funnel report is using." If the two rates come back far apart, stop quoting either until you have decided which population you meant.
Modeling is not GA4 lying to you. It is GA4 answering a question you did not ask, about people it could not see, in a metric that sits next to an event count it left alone. The number in the box is fine. The division you performed on it is where the damage happens.