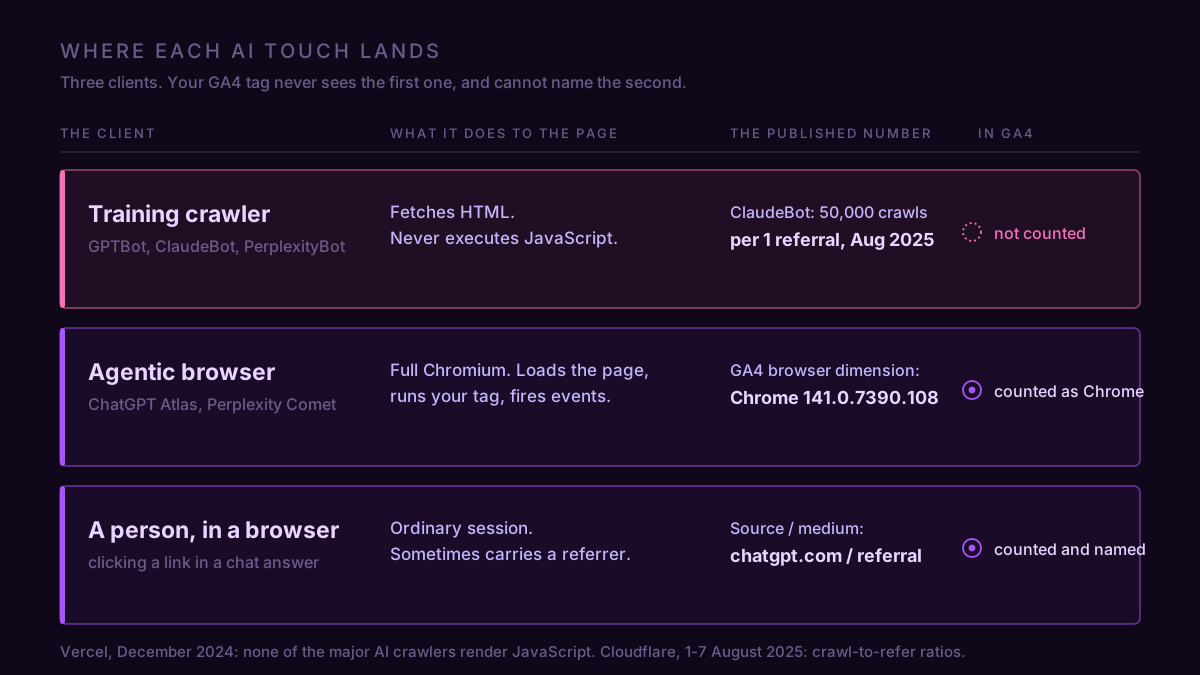
GA4's bot filter has never excluded GPTBot, and it has never needed to. GPTBot was not in the report. Google Analytics arrives as a JavaScript tag. Vercel measured the major AI crawlers across its network and found that none of them render JavaScript: GPTBot pulled JavaScript files in 11.50% of its requests and ClaudeBot in 23.84%, and neither one executed what it downloaded. A client that never runs the tag never sends a hit. Every one of those requests is in your server logs and in none of your GA4 reports.
The standard advice is to enable GA4's bot filter and exclude the rest. It removes nothing, because the sessions it promises to clean up were never counted.
What is counted is the thing nobody filters. ChatGPT Atlas and Perplexity Comet are full Chromium browsers. They load the page, run the tag, fire your events, and report themselves to GA4 as Chrome. One of them shipped in October 2025 and the traffic it produces is already sitting in your Direct channel, indistinguishable from a person with a bookmark.
The crawlers are a server-log problem
Cloudflare publishes the ratio of crawl requests to referrals sent back, per platform. In the first week of August 2025, ClaudeBot made close to 50,000 HTML requests for every single referral Anthropic sent to a site. GPTBot ran 887 to one. Perplexity, 118 to one. Nearly 80% of all AI crawling in that window was for training, and requests made on behalf of a live user question came to under 5%.
Those ratios describe real load on real servers, and none of it appears in Google Analytics. The gap between what your host bills you for and what GA4 shows you is mostly this.
GA4's own bot exclusion works on a list, not on behaviour. Google's documentation names it: "a combination of Google research and the International Spiders and Bots List, maintained by the Interactive Advertising Bureau." The same page closes the door on measuring it: "At this time, you cannot disable known bot traffic exclusion or see how much known bot traffic was excluded." A declared crawler that identifies itself in the user-agent string is on that list. A Chromium browser that identifies itself as Chrome is not, and cannot be.
There is one path by which crawler hits reach GA4, and it is rare: a server-side setup that generates events from web-server logs rather than from the browser. If your tagging starts with a gtag call in the page, which is almost every store, a crawler that skips JavaScript skips you.
One non-AI bot does reach GA4 without a browser, and it is worth ruling out first. Anyone who reads your measurement ID out of your page source can post events straight to the Measurement Protocol, and referral spam has worked that way for a decade. It has a tell the agents don't: the hostname is wrong. Add hostname as a secondary dimension in Reports or as a filter in an Exploration, and if traffic is arriving on a hostname you don't own, that is spam and a hostname data filter is the correct answer. Everything below assumes your hostnames came back clean.
The one that runs your tag reports itself as Chrome
Kick Point installed Atlas on 22 October 2025 and read their own property. The browser dimension came back "Chrome", version 141.0.7390.108. Not similar to Chrome. The same string a stock Chrome install on macOS sends. Comet does the same thing, and Perplexity's own guidance for identifying its agents is to check the request against published IP ranges, because the user-agent is trivially spoofed and not worth trusting alone. Neither check is available to you inside GA4, which sees a parsed user-agent and nothing else.
Two side effects come with the browser rather than the agent. GA4's cookies do not transfer when a user imports their Chrome profile into Atlas, so a returning customer who switches browsers arrives as a new user, and your new-versus-returning split moves without a single new person visiting. And Atlas search traffic attributes as chatgpt.com / referral, sometimes as chatgpt.com / (not set), which lands in the same rows as the ordinary human who clicked a link in a chat answer. If you want that half of the picture properly separated, build the AI channel group and read it as its own channel.
That still leaves the sessions that arrive with no referrer at all, in Direct, on Chrome, on macOS, and never touch a second page.
You cannot name the session, so measure its shape
GA4 will not tell you which sessions were driven by an agent. It will tell you, for free and retroactively, which sessions did nothing.
An engaged session in GA4 is one that lasted longer than the timer, or reached two page views, or fired a key event. The timer defaults to 10 seconds and is a dropdown in your own property settings with six values from 10 to 60. Everything else is an unengaged session, and the unengaged count is where an agent lands: one page, no scroll, no second view, gone.
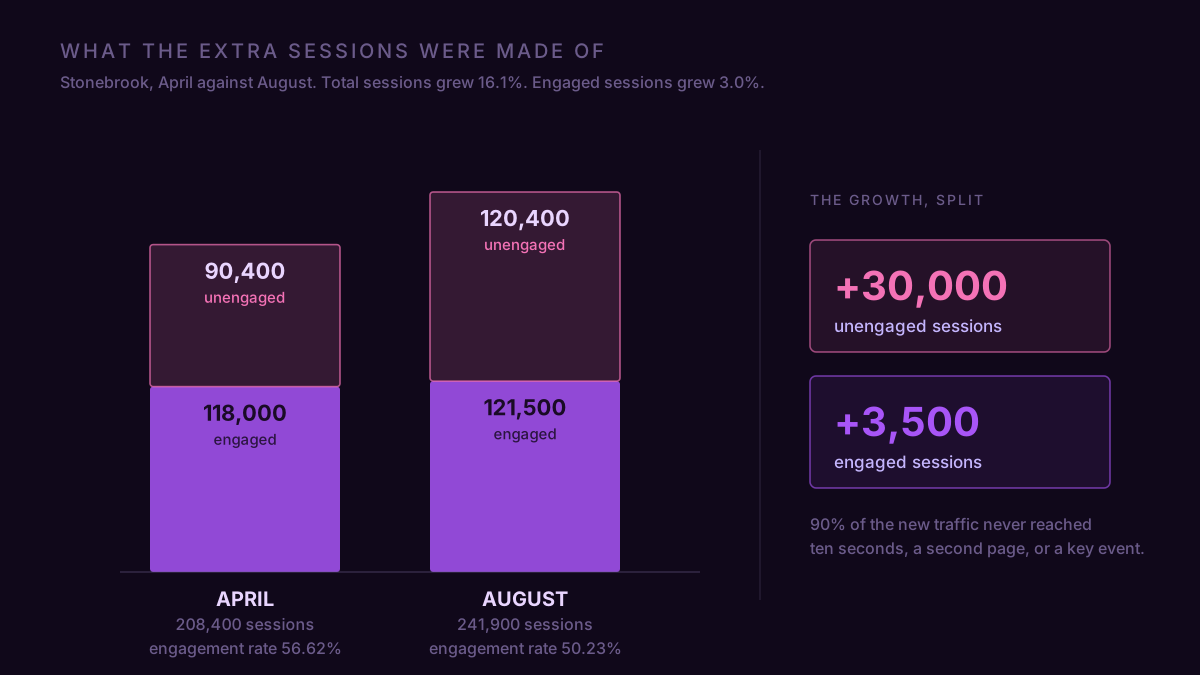
So the shape test is a subtraction. Take total sessions this period against last, take engaged sessions this period against last, and look at which of the two moved. Traffic that grows while engaged sessions hold flat is not an audience. It is a denominator.
Two cross-checks tighten it. Sessions per user falling toward 1.0 on the affected slice means each session arrives with a fresh identity, which is also what the new-versus-returning split will show. And a Direct channel that grew on one operating system rather than across all of them points at a browser that ships on that platform only, which is where Atlas started.
The test has a floor, and it is worth knowing where. An agent that reads a page for twelve seconds clears the default ten-second timer and counts as engaged, so anything the shape test finds is a minimum rather than a census. Raising the timer to catch more of them costs you real humans and breaks your own history, so leave the dial alone and treat the number as the smaller half of the problem.
None of this is proof about any single session. It is proof about the aggregate, which is the level your conversion rate lives at anyway.
A store that lost 0.188 points of conversion rate to counting
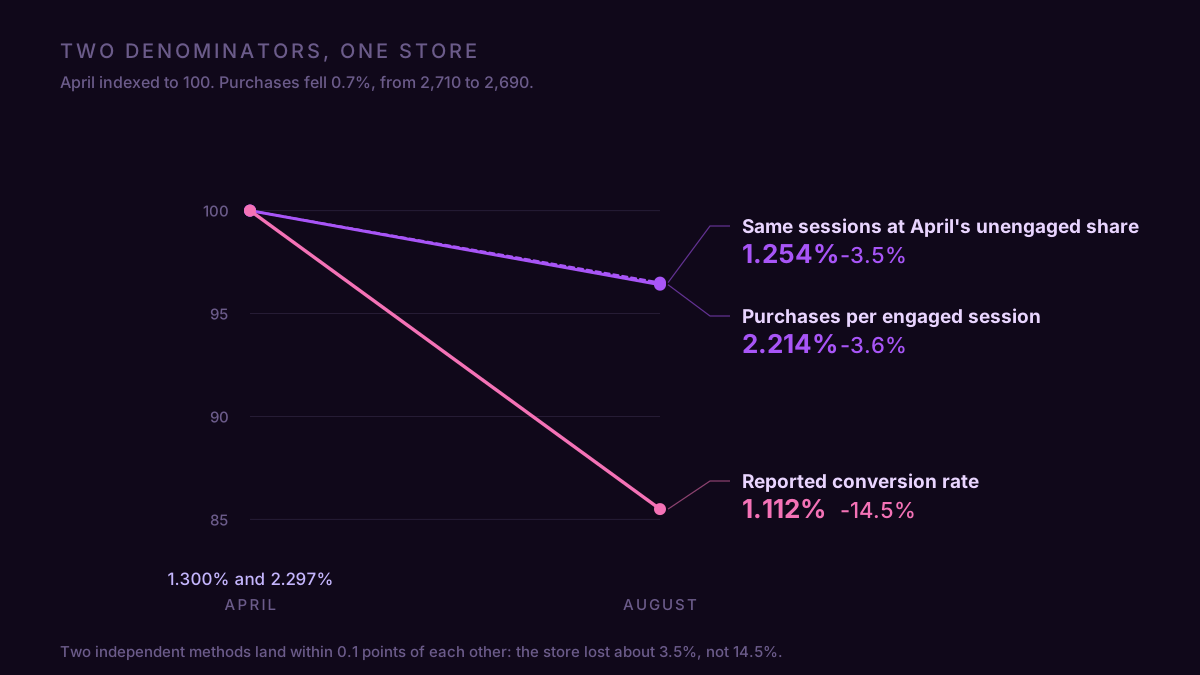
Housewares retailer, call it Stonebrook. April: 208,400 sessions, 2,710 purchases, conversion rate 1.300%. August: 241,900 sessions, 2,690 purchases, conversion rate 1.112%. A 14.5% relative fall in the rate. Nothing had been deployed to the site since June, and the team was two weeks into rebuilding the product page.
The 33,500 extra sessions split 30,000 unengaged and 3,500 engaged. Engagement rate went 56.62% to 50.23%. Direct sessions on Chrome under macOS went from 18,300 to 41,600, and chatgpt.com / referral from 1,240 to 6,800, while Windows and Android Direct moved by less than 4%.
Hold the unengaged share at April's 43.38% and August's 121,500 engaged sessions imply 214,600 total, which puts the conversion rate at 1.254%. Of the 0.188 points lost, 0.142 came from the denominator and 0.046 from the store. Three quarters of the drop was counting.
The remaining quarter was real and worth the meeting. It was also 0.046 points, not 0.188, and it pointed at a different page than the one being rebuilt.
Two ways of asking agree to a tenth of a point. Holding the unengaged share constant says the store lost 3.5%. Dividing purchases by engaged sessions, which never touches the unengaged count at all, says 3.6%. When a correction and an independent metric land on the same answer, the denominator was the story.
Change the denominator before you touch the filter
The instinct at this point is to build a GA4 data filter and exclude the traffic. Do not. Google's own wording: "if you apply an exclude data filter, the excluded data is never processed and will never be available in Google Analytics or BigQuery." Filters run from the point of creation forward, so they cannot repair the April-to-August comparison you actually need, and they delete the evidence for the next one. You would also be excluding every human who bounced in nine seconds, and on the average property that is more than four sessions in ten.
Switch the denominator instead. Purchases per engaged session is the same numerator over a base that agents do not enter. Stonebrook's went 2.30% to 2.21%, down 3.6% against the 14.5% the headline rate was showing. That is one metric change, no filters, and it survives whatever the agents do next quarter.
Keep the session-based rate as well, for the same reason you keep a thermometer. Stonebrook's two rates were 10.9 points apart in relative terms by August, having been the same measurement in April, and that spread is the cleanest single number for how much of your traffic never engaged. And treat the whole comparison the way you would treat any sudden move in GA4 traffic: confirm the shape before you accept the cause.
Checking your own property
Four numbers, one report each. Engaged sessions against total sessions for the last 90 days versus the 90 before, split by device and operating system. New users against returning. Sessions per user on your Direct channel. And your chatgpt.com rows, which are the only part of this that GA4 will name for you.
If those four move together, your conversion rate fell without your conversion doing anything, and the exact numerator sitting on an inflated denominator is the whole finding.
Pulling them by hand is four Explorations and a spreadsheet. ConvRadar is a hosted GA4 MCP server that reads the live property from inside Claude or ChatGPT, so the ask is one sentence: "Split sessions and engaged sessions for the last 90 days against the previous 90 by operating system and channel, give me the conversion rate on both denominators, and tell me how much of the change is unengaged growth." It comes back with the split, and the arithmetic is shown.
Your traffic went up and your conversion rate went down. Before anyone rebuilds a page over it, find out how many of the new visitors were people.