Published GA4 engagement rate benchmarks cluster near 56%. Split the same traffic by channel and the number runs from 42.62% to 72.50%. Both numbers are real measurements. Neither one is a benchmark, because the metric being measured is partly a dropdown in your own property settings, and nobody publishing a benchmark tells you where their sample had it set.
Most metrics at least hold still while you compare them. A conversion is a conversion. Add-to-cart has three denominators in circulation, and that's already bad enough, but the denominators are knowable once someone states which one they used. Engagement rate has a knob. The site owner can turn it, and turning it moves the number without a single visitor behaving differently.
The number depends on a dropdown
GA4 calls a session engaged if any one of three things happened. It lasted longer than ten seconds, or it fired a key event, or it produced two or more page or screen views. Any one is enough. Engagement rate is the share of sessions that cleared that bar, and bounce rate is the share that didn't, which is why the two always sum to 100 in GA4.
The ten seconds is a default, not a definition. Open Admin → Data Streams → your web stream → Configure tag settings → Show all → Adjust session timeout, and under Adjust timer for engaged sessions you can set it to 10, 20, 30, 40, 50 or 60 seconds. Six values. The change applies immediately and is not retroactive, so historical sessions keep whatever rule was live when they happened.
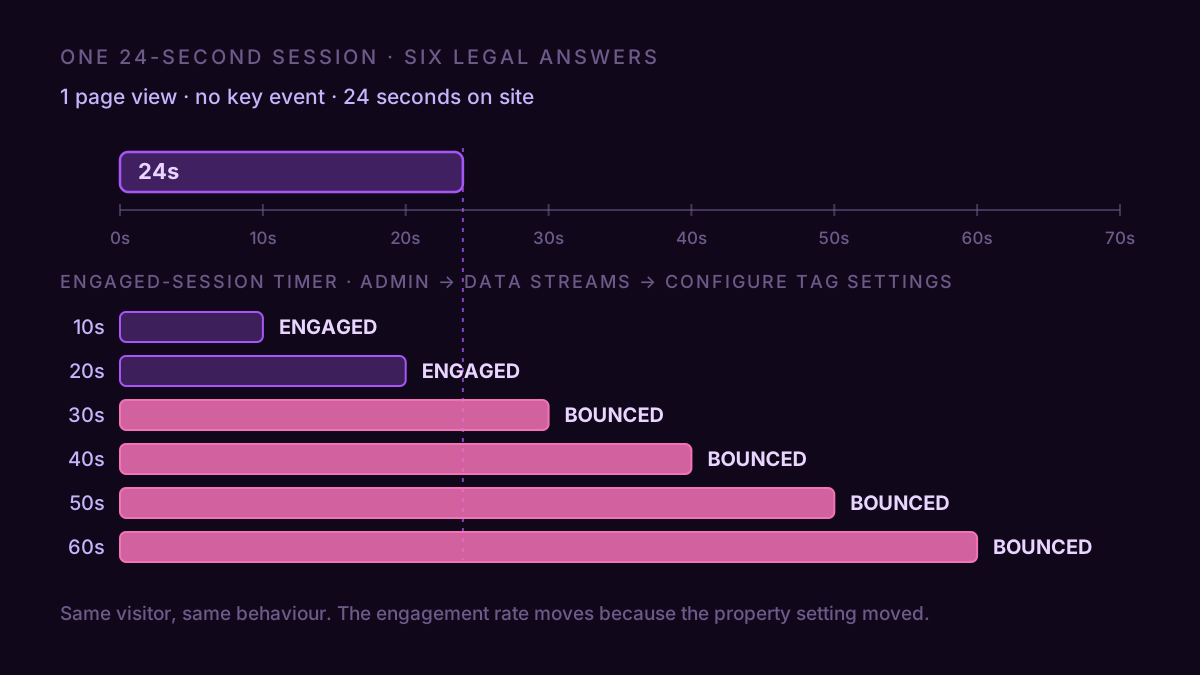
Take a single visitor: one page view, no key event, twenty-four seconds on the page. On a default property that's an engaged session. On a property whose owner moved the timer to thirty seconds because their content is long-form, it's a bounce. Same human, same behaviour, opposite label, and both properties are configured correctly. Every session that cleared the timer and nothing else flips when the dial moves. If one session in ten sits in that window, going from 10 seconds to 30 costs ten points of engagement rate on a site where nothing changed.
One more wrinkle in the clock. The ten seconds are ten seconds of engagement time, which GA4 accrues only while the tab is in the foreground, tracked through the Page Visibility API. A visitor who opens your page in a background tab and leaves it there for an hour accumulates zero. The timer measures attention, not patience. It's the right call, and it's also why "time on site" from any other tool will never reconcile with GA4.
GA4's bounce rate is not the bounce rate you remember
Universal Analytics called a session a bounce when it contained one interaction hit and nothing else. Someone who landed, read a 2,000-word article for five minutes and left was a bounce. In GA4 that same session is engaged three times over: past ten seconds, and it very likely fired a scroll key event on the way.
That matters because most of the bounce-rate benchmarks still circulating were built on the UA definition. A property that reported 62% bounce in UA typically reports around 52% in GA4, and nothing about the site changed. Comparing your GA4 bounce rate against a benchmark table assembled from UA-era data hands you a ten-point gift or a ten-point indictment depending on which direction you were hoping for.
What the published numbers actually say
Three sources survive a methodology check. Each carries a date that matters more than the figure.
| Source | Sample | Period | Figure |
|---|---|---|---|
| Databox | 15 industries, GA4 | Aug 2023 | Median engagement 56.23%; ecommerce 63.86%, SaaS and consulting 52.43% |
| Siege Media | 304 GA4 properties | Jul 2023 – Jul 2025 | Engagement by channel, 42.62% (paid social) to 72.50% (paid shopping) |
| Contentsquare | 99B sessions, 6,500 sites | 2026 | Engagement down 10% year over year, on Contentsquare's own instrument |
The third row is the one people misuse. Contentsquare runs its own tag and its own definition of engagement, so its −10% tells you which way the wind is blowing and nothing at all about where your GA4 number should sit. Quoting it as a GA4 benchmark is the same mistake as quoting a UA bounce rate. The first two rows are GA4, and both are old enough that the levels have drifted; what travels is the shape.
Now put two published GA4 industry tables side by side and watch the shape survive while the levels don't. Databox's fifteen-industry read from August 2023, against Digital Applied's 2026 table, which aggregates several benchmark providers and doesn't disclose a sample size, so treat it as indicative.
| Industry | Databox, Aug 2023 | Digital Applied, 2026 | Gap |
|---|---|---|---|
| Ecommerce | 63.86% | 58.3% | 5.6 pts |
| SaaS / B2B | 52.43% | 50.8% | 1.6 pts |
| Travel | 61.55% | 52.4% | 9.2 pts |
| Health | 62.22% | 43.2% | 19.0 pts |
Nineteen points on healthcare. Both tables are labelled GA4, both are quoted as benchmarks, and a healthcare marketer picking one over the other swings from comfortably above par to badly failing without touching the site. Some of that is three years of drift and different samples. The rest is that neither table can tell you where its properties had the timer set, or how many of them fire a scroll key event that quietly promotes half their bounces to engaged sessions.
The channel spread is 2.6× the industry spread
Here's the shape. Across Siege Media's 304 properties, engagement rate by channel spans 29.9 points. Across Databox's fifteen industries, it spans 11.4 points. Different samples, drawn on one chart for scale and not as a like-for-like comparison. But a 2.6× difference doesn't come out of sampling: where your traffic comes from explains far more of your engagement rate than what business you're in.
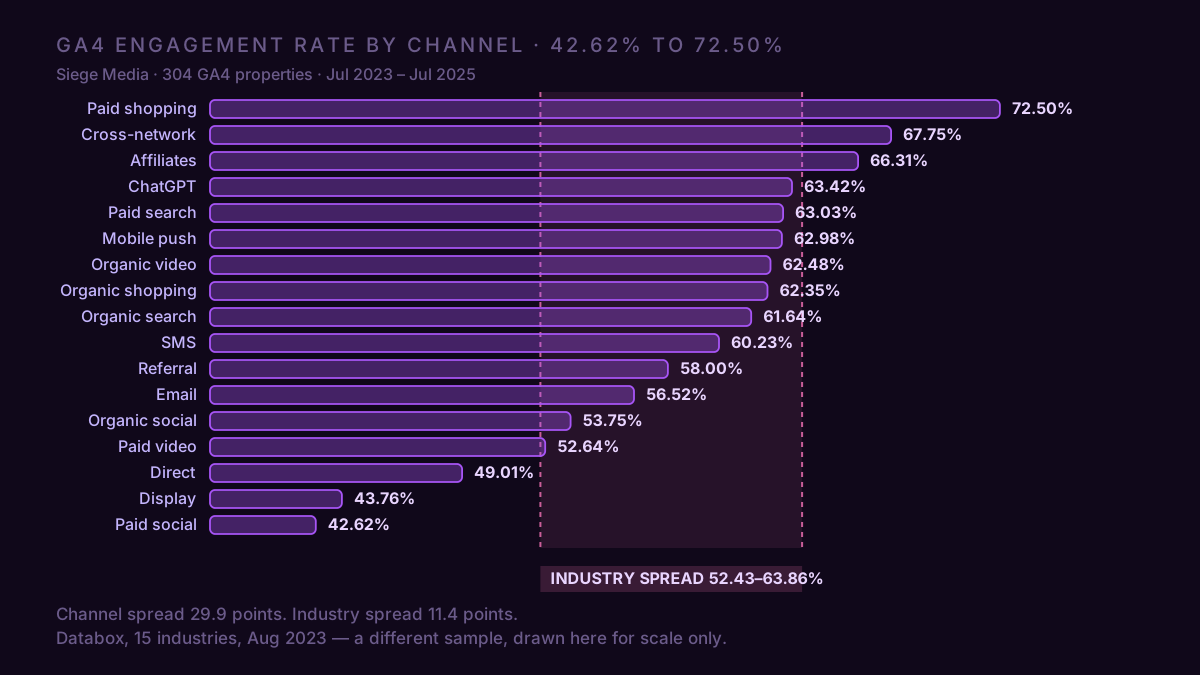
Paid social sits at 42.62% and paid shopping at 72.50%. That's not a quality gap between advertisers, it's an intent gap between a person who was scrolling and a person who was shopping. The same ordering shows up in conversion rate by channel, where search, email, direct and referral cluster near 5% and the social channels sit near 2%. Engagement and conversion are measuring different things and agreeing on the same cause.
ChatGPT lands at 63.42%, just ahead of Google organic search at 61.64%, so AI-referred visitors arrive at least as engaged as search visitors and the "AI traffic is junk" line doesn't survive contact with the data. It also doesn't mean they buy at the same rate, which is a separate question with a much messier answer. And Direct at 49.01% is the channel most likely to be dragging your average down while telling you nothing, because Direct in GA4 is mostly a bucket for sessions whose real source went missing.
A four-point drop with nothing broken
A store — call it Northlight — ends Q1 with a 56.56% engagement rate across 100,000 sessions. Q2 they push hard on paid social. Traffic goes to 140,000 sessions and engagement rate falls to 52.58%. The weekly report calls it a site quality problem and someone starts auditing landing pages.
| Channel | Engagement rate | Q1 share | Q2 share |
|---|---|---|---|
| Organic search | 61.64% | 38.0% | 27.1% |
| Direct | 49.01% | 24.0% | 17.1% |
| Paid search | 63.03% | 12.0% | 8.6% |
| 56.52% | 9.0% | 6.4% | |
| Referral | 58.00% | 6.0% | 4.3% |
| Organic social | 53.75% | 5.0% | 3.6% |
| Paid social | 42.62% | 6.0% | 32.9% |
| Blended | 56.56% | 52.58% |
Every channel holds its rate to the second decimal. Paid social went from 6% of sessions to 32.9%, and because it engages 14 points below the site average, the weighted mean drops 3.98 points on arithmetic alone. Engaged sessions over the same stretch went from 56,561 to 73,609, up 30.1%. The campaign worked. The headline metric fell.
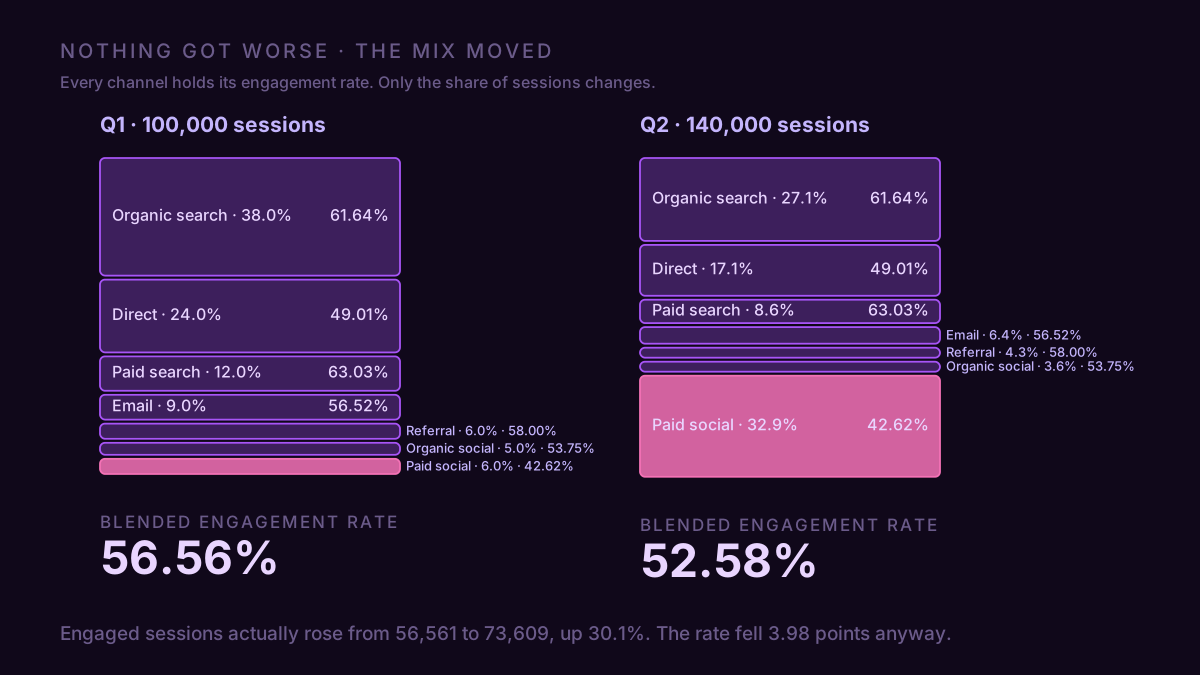
This is the same failure that makes a blended conversion rate unreadable when the new-versus-returning mix moves, and it bites harder here because 29.9 points of channel spread is a lot of room for the weighted mean to travel. The right question about Northlight's paid social isn't "why is it below our site average" — it will always be below the site average. It's "is 42.62% good for paid social", and there the honest answer is that it's exactly on the cross-site line, so the campaign is engaging people at the normal rate for the channel it's buying.
Reading your own number
Start by checking your timer. Anything other than 10 seconds and every published figure is measuring a different thing from yours, which you'll have to say out loud each time you quote the metric. If someone changed it mid-year, the step in your engagement rate on that date is the setting, not the site, and it's worth ruling out before you go hunting for a cause that isn't there.
Next, separate mix from quality before you argue about either. Take this period's engagement rate for each channel, multiply it by last period's share of sessions, and sum. If that counterfactual lands close to what you actually reported last period, nothing got worse and the mix moved. Northlight's comes out at 56.56%, to the decimal what they reported in Q1, so all 3.98 points are mix.
After that, stop looking at the site-wide figure at all. Reports → Acquisition → Traffic acquisition already carries Engagement rate as a column next to the default channel grouping, so the channel split costs you one click and no configuration. Compare each channel against its own previous period, on your own property, at your own timer setting. That comparison is definitionally clean in a way no cross-site benchmark can be, and it's the only benchmark discipline that survives contact with real data: use the outside numbers to find which row looks wrong, use your own history to decide whether it got worse.
If you want a pass line, take it per channel, and only once your timer is on the default 10 seconds — every figure below inherits that assumption from a panel whose own settings nobody published. My rule of thumb is five points under the cross-site figure for that channel: organic search below 57%, email below 52%, paid social below 38%. Above that the gap is sampling and seasonality; below it, something on the landing side is losing people who arrived willing. Site-wide there is no pass line worth having, only your own last quarter at the same timer setting.
When a channel really has gone soft, the cause is usually on the other end of the click rather than in the analytics. A channel whose engagement falls while its share holds steady is sending the same people to a page that changed, or to a page it never suited, which is where most of AI referral traffic's problem turns out to live.
The faster path skips the report. Point your AI client at GA4 and ask it plainly: "split engagement rate by session default channel group for the last 90 days versus the 90 before, hold the channel mix constant, and tell me how much of the change is mix and how much is real." It reads the live property, does the weighting, and comes back with the split in a sentence. That's the whole analysis above, minus the spreadsheet.
A number you can move by changing a dropdown is a diagnostic, not a grade. Use it to find which channel is sending people who leave, and let somebody else argue about whether 56% is good.