6.6% is the lead-gen conversion rate everyone quotes. It's also a landing-page number — campaign traffic on a dedicated page — from Unbounce's benchmark, and it has almost nothing to do with your whole-site rate, which runs closer to 1–4% by industry. Compare across the two and a perfectly healthy B2B site talks itself into a redesign it never needed.
Every "lead gen benchmark" post stacks these without saying so. A landing-page rate (6.6%), a form completion rate (~50%), and a whole-site visitor-to-lead rate (~2.5%) land in the same table, three unrelated fractions wearing the word "conversion." A founder sees 6.6%, opens GA4, reads 2.4%, and starts rebuilding a site that was converting exactly on par.
So the denominator comes before the number.
Three "conversion rates," three denominators
Session → lead is leads over all your sessions — the whole property, every visitor, not only the ones who reached a form. This is the honest site-wide figure, and it's what the bands below use. Site-wide medians cluster at 2–4%.
Landing-page conversion is conversions over sessions on a dedicated campaign page. That's the 6.6% world: a smaller, warmer denominator, so a bigger number. It grades a specific paid page and nothing else.
Form completion is form_submit ÷ form_start — of the people who started your form, how many finished. Median near 50%. It says whether the form is the problem; it says nothing about whether people reach it.
Pick which one you're actually measuring. Then read a band.
The bands, by industry (session → lead)
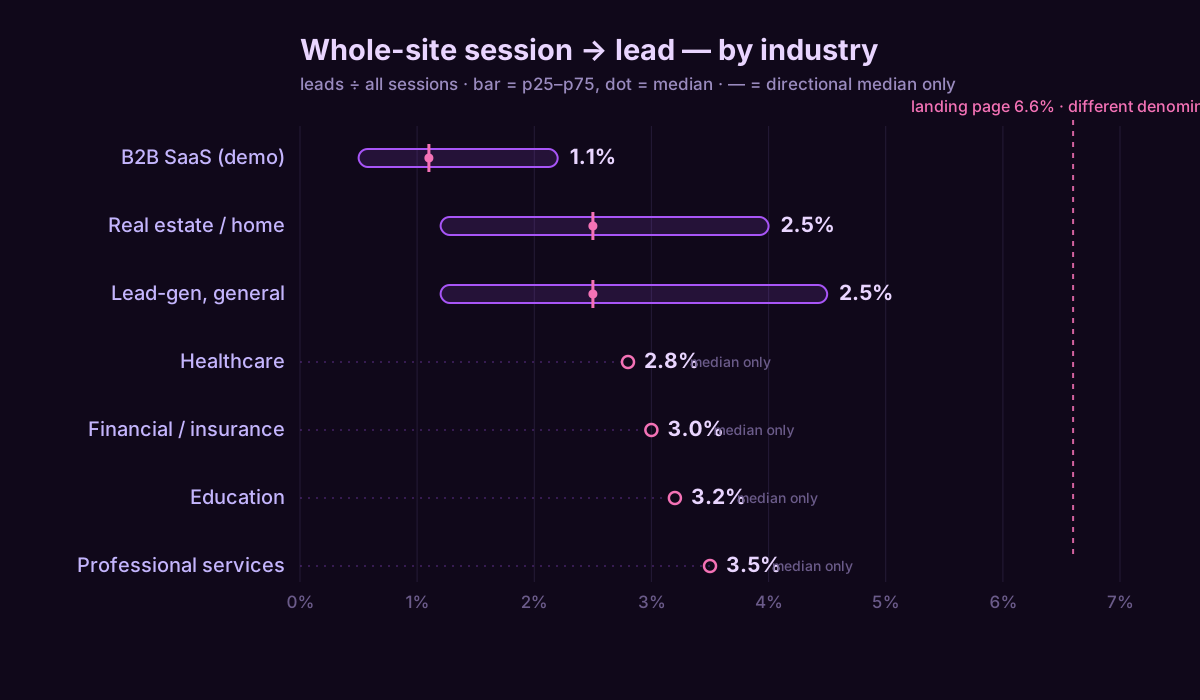
These are ConvRadar's calibrated whole-site session-to-lead bands. The median is anchored to the public source named; the range is modeled from the spread where the data supports it. Where the public data only gives a directional median, that's all you get — inventing a p25 and p75 would be false precision.
| Industry (whole-site session → lead) | p25 | Median | p75 | Source |
|---|---|---|---|---|
| B2B SaaS (demo / contact) | 0.5% | 1.1% | 2.2% | B2B SaaS composite 2024 |
| Real estate / home services | 1.2% | 2.5% | 4.0% | Real estate + home services 2024 |
| Lead-gen, general | 1.2% | 2.5% | 4.5% | Ruler Analytics + WordStream 2024 |
| Healthcare | — | 2.8% | — | Healthcare composite 2024 (directional) |
| Financial / insurance | — | 3.0% | — | Financial composite 2024 (directional) |
| Education / e-learning | — | 3.2% | — | Education composite 2024 (directional) |
| Professional services | — | 3.5% | — | Prof-services composite 2024 (directional) |
Professional services convert visitors to leads at roughly three times the rate of B2B SaaS, because a law firm's visitor is often ready to talk while a SaaS visitor is still reading docs. And the dashes are deliberate: for healthcare, finance, education and professional services the public data gives a believable median but not a real distribution, so those rows show the median and stop.
Your exact industry not on the list? Map to the nearest behaviour, not the nearest label: agencies, consultancies, legal and accounting sit with professional services; clinics and dental with healthcare; contractors, roofers and movers with home services; anything self-serve software with B2B SaaS; everything else on the general row.
If you've read a higher number for your industry, you probably read a hotter dataset. Ruler's own by-industry table puts legal at 7.4% and overall B2B at 2.9% — above every band here. That's not a contradiction; it's a different crowd. Ruler's population self-selects for businesses that live on lead gen and already run call tracking, so it counts the phone half and leans toward sites built to convert. These bands are the broader long tail: the ordinary site, forms-first, every visitor counted. The general row sits at 2.5% precisely because it blends Ruler's 2.9% with WordStream's leaner 2.35% cross-industry median. Same denominator name, different sample — pick the one you actually belong to.
One mismatch to expect on your own site: the B2B SaaS session-to-lead number here (~1.1%) is the demo/contact rate, not the SaaS trial-start rate (~3.8%) from the SaaS benchmarks. A demo request and a self-serve trial are separate actions over separate denominators. And "lead conversion rate" sometimes means lead-to-customer in the CRM — a sales-stage number that never touches GA4. Everything here is the top of that funnel: visitor to lead.
The half of your leads that isn't a form
Ruler's 2.9% median splits into 1.7% from forms and 1.2% from phone calls. Count only form submissions and you're seeing a little over half your actual conversions — and benchmarking the smaller number against a total.
For anyone whose buyers pick up the phone — home services, legal, medical, high-ticket B2B — an untracked call is an invisible lead. GA4 shows 1.7%, the benchmark says 2.9%, and a quarter goes into "fixing" a gap that was really just calls nobody logged. Most of the low lead rates I get asked to diagnose turn out to have a phone number sitting under them. Track the calls before you decide the site is the problem.
A worked example
A commercial insurance broker, 18,400 sessions last month, 312 form leads. Session-to-lead on forms: 1.7%.
Next to "6.6%," that's a catastrophe. Next to the row that applies — financial/insurance, median around 3.0% — it's below par but the same species of number. Then the CRM turns up 240 inbound calls that started on the site, none of them in GA4. Real session-to-lead is (312 + 240) / 18,400 = 3.0% — right on the median. Nearly half the leads simply weren't wearing a form.
The redesign the founder had already scoped would have chased a number that was fine. Stopping that is the entire job of a benchmark.
Which of these you can measure in GA4
Session-to-lead is yours today, after one setup step: mark your lead action — generate_lead, your form_submit, or a contact event — as a Key Event in GA4. Until you do, GA4 logs the hit and refuses to hand you a rate; then leads ÷ sessions is a division you can run any month. Form completion needs both form_start and form_submit firing, which most sites have and never marked. Phone calls need a call-tracking number or a tap-to-call event — the part GA4 can't invent for you, and the part that moves your number most.
Keep the bands in a doc and do the math by hand every month, or put GA4 inside the AI client you already have open. Connect it and the check becomes a question — "is my session-to-lead rate below the professional-services median, and how much of it is calls I'm not counting?" — answered against your real sessions. If the answer's yes, the conversion-drop diagnostic tells you which page and which source. Selling products or software instead of booking calls? Different denominator again: the ecommerce and SaaS bands are yours.
The broker was one call-tracking number away from knowing the site was fine. Most people redesign instead.