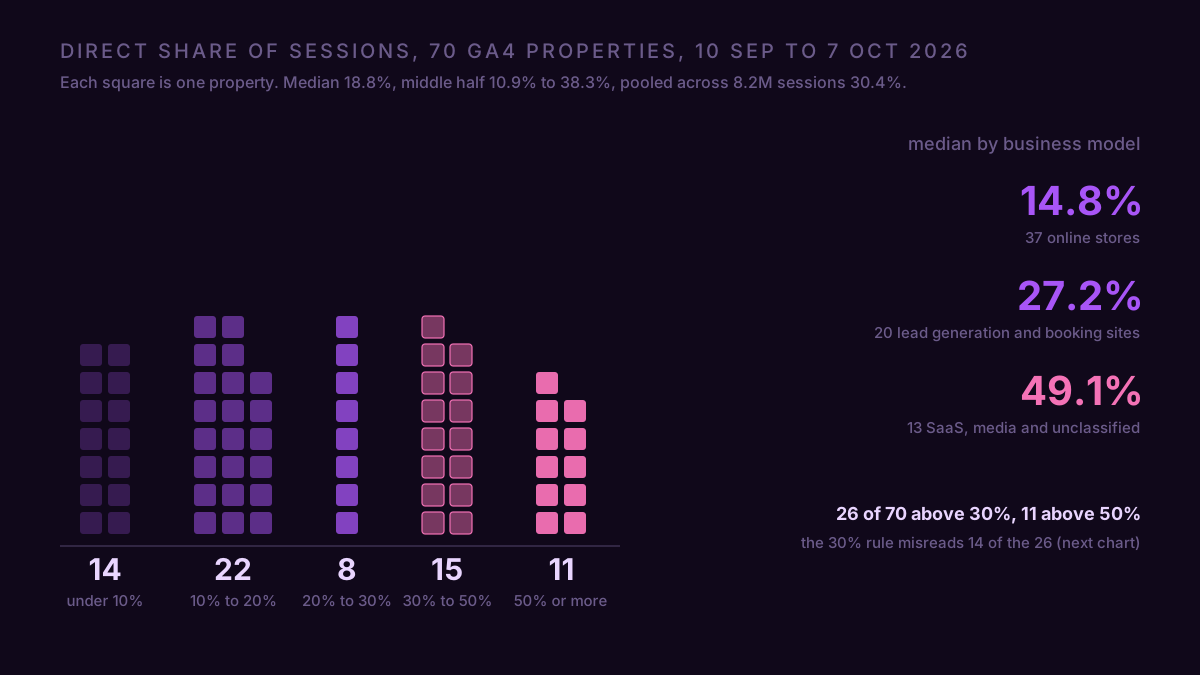
Direct traffic is 18.8% of sessions on the median GA4 property, measured across 70 Google Analytics 4 properties connected to ConvRadar, each with 1,000 or more sessions and 28 synced days between 10 September and 7 October 2026. The middle half of properties runs from 10.9% to 38.3%. 30% Direct is not a fault on its own: 26 of the 70 GA4 properties sit above it, 11 sit above 50%, and 14 of the 26 have new Direct sessions engaging at least 60% as often as the rest of the site. Added up across all 8.2 million sessions, Direct is 30.4%, and four properties hold 69.5% of those sessions, so the sum is their number more than anyone's.
Orbit Media's 36% across 56 million sessions on 145 accounts from September 2025 to August 2026 is the same kind of sum. Clickport's median of 29% over its own sites in the 30 days to 2 August 2026 is a median, and 18.8% sits well below it.
Direct traffic is 14.8% of GA4 sessions on the median ecommerce store (37 stores), 27.2% on the median lead generation or booking site (20 sites) and 49.1% on the median SaaS, media or unclassified property (5 SaaS, 4 media, 4 without a model), measured 10 September to 7 October 2026. A product whose users type the URL or open a bookmark every morning has Direct as its front door. Of six guides found for this article, three draw the line at 30% and one puts the healthy range at 5% to 20% for established websites; both lines label the median SaaS property broken.
Is 30% Direct traffic too high? 14 of the 26 properties above it are not floods
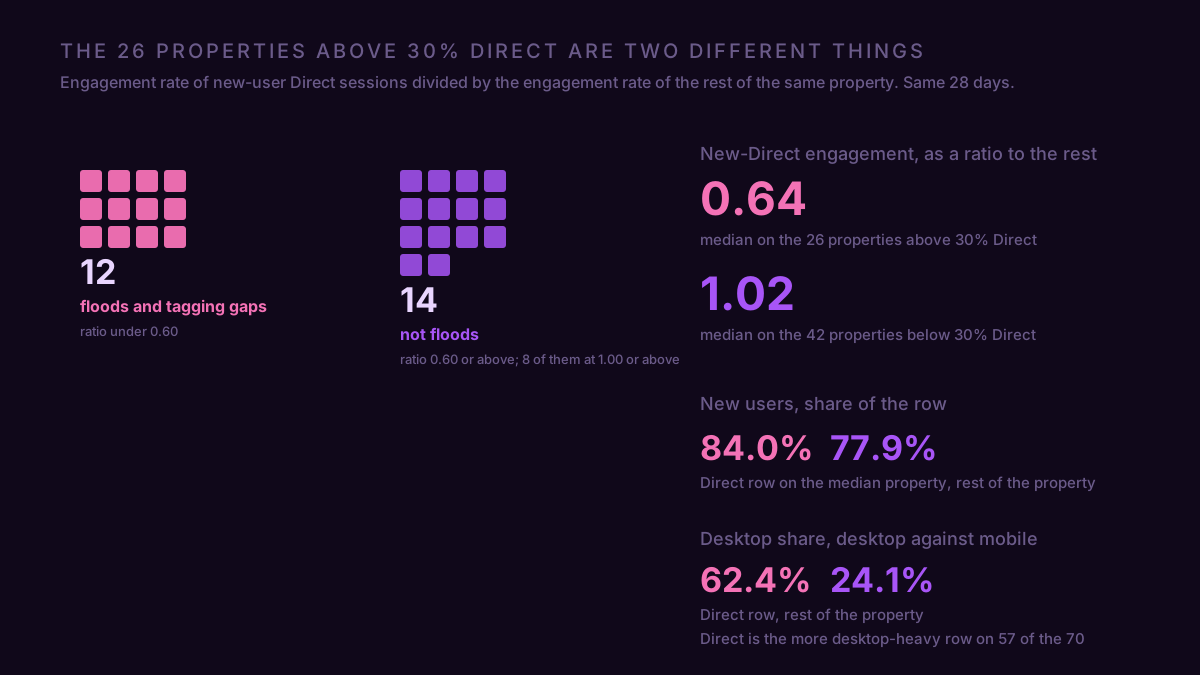
The test that separates them is the engagement rate of new-user Direct sessions, read against the engagement rate of everything that is not Direct on the same property. On the 26 properties above 30% Direct, that ratio is 0.64 on the median property: new Direct sessions engage about two thirds as often as the rest. On the 42 properties below 30% with enough Direct to measure, the ratio is 1.02: new Direct sessions behave like everyone else. Within the 26, 12 properties sit under 0.60, 6 sit between 0.60 and 1.00, and 8 sit at or above 1.00, among them a SaaS product at 67.9% Direct whose new Direct sessions engage 73% of the time against 59% for its other channels, and a media property at 85.5% Direct where 86% of Direct sessions are returning users and 91% engage. The share cannot tell these apart. The ratio can.
Two more cuts say the same thing from different angles, and each is the median of a within-property comparison, not two averages set side by side. New users are 84.0% of Direct sessions on the median property against 77.9% of the rest of the property's sessions, and Direct is the newer row on 46 of the 70 properties, so "typed the URL from memory" is not what Direct mostly holds anywhere. Direct is 62.4% desktop on the median property, counting desktop against mobile, while the rest of the same property is 24.1% desktop, and Direct is the more desktop-heavy row on 57 of the 70 properties by a median 20 points. Above 30% Direct the row is 81.9% desktop against 42.1% for the rest; below 30% it is 51.7% against 19.1%. A desktop-heavy Direct row on a mobile-heavy site has candidates with names: staff, monitoring scripts, a tag firing inside an embed, scrapers. The data here cannot say which. It can say the row is not the site's customers.
One caveat on the 14. A booking site in that group reports 100% engagement on its new Direct sessions and 95% on the rest, which is a key event firing on every session, so its ratio is 1.05 by construction. The test needs an engagement rate that can fall.
Does Direct convert better or worse than other channels
Direct traffic converts at 1.02% of sessions on the median online store and every other channel together at 1.41%, on the 19 GA4 stores with 50 or more orders between 10 September and 7 October 2026. Those are two medians from two columns, and store by store the picture is even: on 10 of the 19 the Direct row outconverts the rest of the property. Split each row by visitor type and the real gap appears. Direct sessions from returning users convert at 2.30% on the median store and Direct sessions from new users at 0.61%; the other channels read 2.67% for returning and 0.73% for new. Within a store, returning Direct converts at 3.15 times new Direct on the median store, and returning visitors from the other channels at 2.07 times their new ones. On 11 of the 19 stores new Direct converts at or above new visitors from the other channels, and on 12 of 19 returning Direct outconverts returning visitors from the other channels. Four of the 19 stores have fewer than 10 Direct-returning orders in the window, so the 2.30% is a median of thin cells on that side.
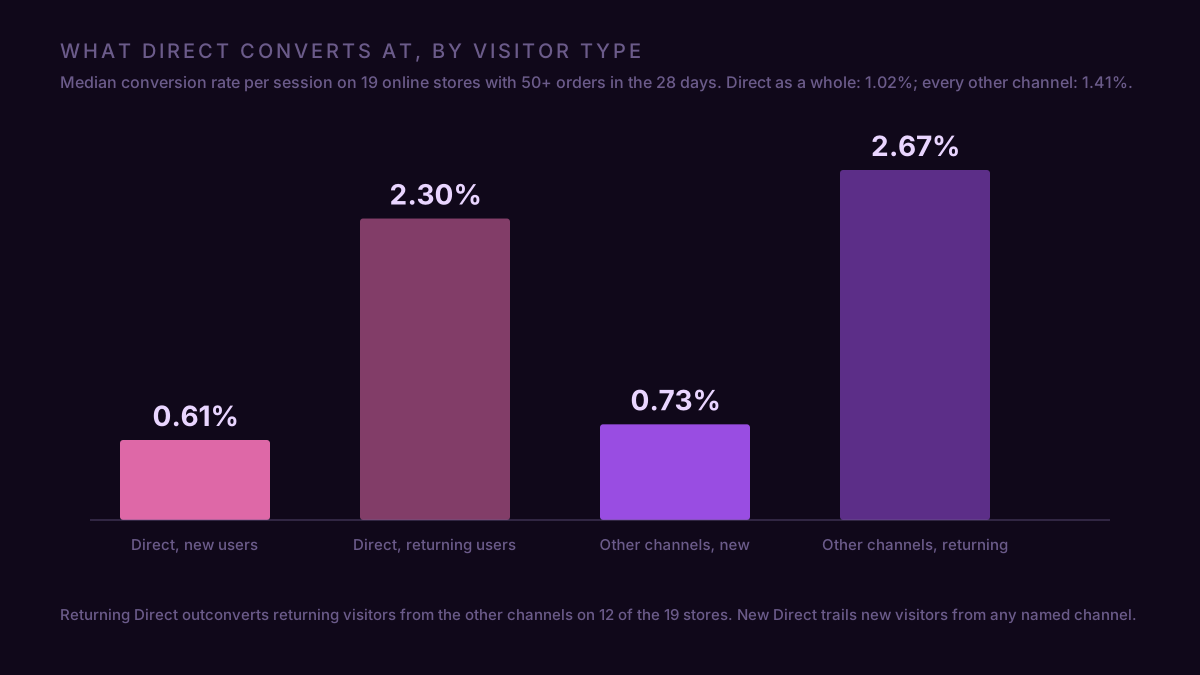
So the line that matters is not between Direct and the rest. It runs between new and returning inside every channel, and returning visitors convert more everywhere, 1.7 times on the pooled public benchmark and 2 to 3 times on these stores. Direct simply carries more of the new kind: 84% of its sessions, against 78% for the rest of the property. Direct is high because of its new-user half, and what puts sessions in that half is the list from the attribution article: referrers stripped in transit, email and app links without tags, and automated sessions. The engagement and device split above says which of those a given property is looking at before anyone opens a tag manager.
One store at 97.6% Direct, and why the bot checks do not catch it
The largest flood in the set is an online store that recorded 868,591 sessions in the 28 days, 848,173 of them Direct, after 480,122 sessions with 460,023 Direct in the window before and 354,924 with 332,408 Direct in the window before that. The Direct row is 99.9% new users and 99.5% desktop on a store whose other channels are 67% mobile, and it engages 17.7% of the time against 70.1% for every other channel. 75 orders came in, 16 of them from the Direct row. On the Direct row that is a conversion rate of 0.002%; on the 20,418 sessions outside it, 0.29%.
The four checks that measure bot traffic in GA4 do not flag this row, because they require engagement under 10% and no conversions, and this row engages at 17.7% and carried 16 orders. Whatever it is, it waits ten seconds or loads a second page in roughly one session of six, and a tag firing inside an embedded widget or a monitoring script fits that shape as well as a bot does. The reading is the same either way: 97.6% of the property is new desktop users converting at 0.002%, and every rate on the property has to be read without them.
The opposite case sits in the same set. A SaaS product recorded 110,442 sessions, 67.9% of them Direct, 91% of the Direct row new users, and the row engages 70.4% of the time against 59.4% for the rest. Nothing there needs fixing. Users who sign in from a second device, clear cookies or open the app from a desktop shortcut all count as new, and the engagement says they are users.
Has Direct been rising
54 of the 70 properties had 28 full days in each of the three windows from 16 July to 7 October 2026. The median Direct share across them went 20.3%, 17.6%, 17.1%. The share of all their sessions went 24.7%, 27.1%, 30.5%, and without the two flooded stores it went 18.5%, 15.9%, 18.3%. A rising Direct line on an industry chart is a few properties getting flooded, not everyone's bookmarks multiplying.
Between the last two windows the median property moved its Direct share by 3.5 points in either direction, and 7 of the 54 moved by 10 points or more; between the two windows before, the median move was 2.5 points and 8 properties moved 10 or more. A ten-point jump in a month happens to about one property in seven, and it is worth the five-minute check below the same week.
How to read your own Direct row
Open Explore → Blank, set the last 28 days, filter Session source / medium to (direct) / (none), put New / returning and Device category in rows, and Sessions, Engagement rate and Key events in values. Use New / returning, the dimension GA4's API calls newVsReturning; the similar-looking New / established counts users from the last 7 days and gives a different split. Then run the same exploration once more without the filter, because the comparison is against the rest of the property, and three numbers come out. The share of Direct that is new users, 84% on the median property and 90% or more where floods live. The engagement rate of those new Direct sessions divided by the engagement rate of the rest, 1.02 on the median property below 30% Direct and 0.64 above. The desktop share of Direct against the desktop share of the rest. New users above 90%, desktop above 80% and an engagement ratio under 0.60 is a flood, and the bot traffic article has the steps for reading the property without it. New users above 90% with an engagement ratio near 1 is a tagging gap, and the attribution article has the causes, from stripped referrers to untagged email. A Direct row that is mostly returning users is customers, and the report ends there.
What the two explorations will not give you in one place is the conversion side: Direct against every other channel, new and returning side by side, with the rest of the property's rate next to it. Connect GA4 to ConvRadar and ask Claude or ChatGPT what share of your Direct sessions are new users on desktop, how many of them engaged, and what Direct converts at next to your other channels; a lead generation site with fewer than 30 leads in the window gets counts rather than a rate.
Direct is 18.8% on the median property. On yours, the number that matters is how many of those sessions are new users on desktop who engage like nobody who buys.