Bot traffic was 0.7% of GA4 sessions overall and 0.0% on the median property across 70 Google Analytics 4 properties connected to ConvRadar, each with at least 1,000 sessions, between 10 September and 7 October 2026. The 0.7% is 58,351 of 8.2 million sessions, sitting in traffic-source rows with an engagement rate under 10%, fewer than 1.2 pages per session and no orders. Of the 70 properties, 50 had 0% bot sessions in those 28 days, 9 had under 1%, 7 had 1% to 5%, 2 had 5% to 15%, none had 15% to 75%, and 2 had more than 75%: 78% on a media site and 94% on an online store. Bot traffic in GA4 is not a percentage you carry around. It is a switch, off for most sites until the month it flips.
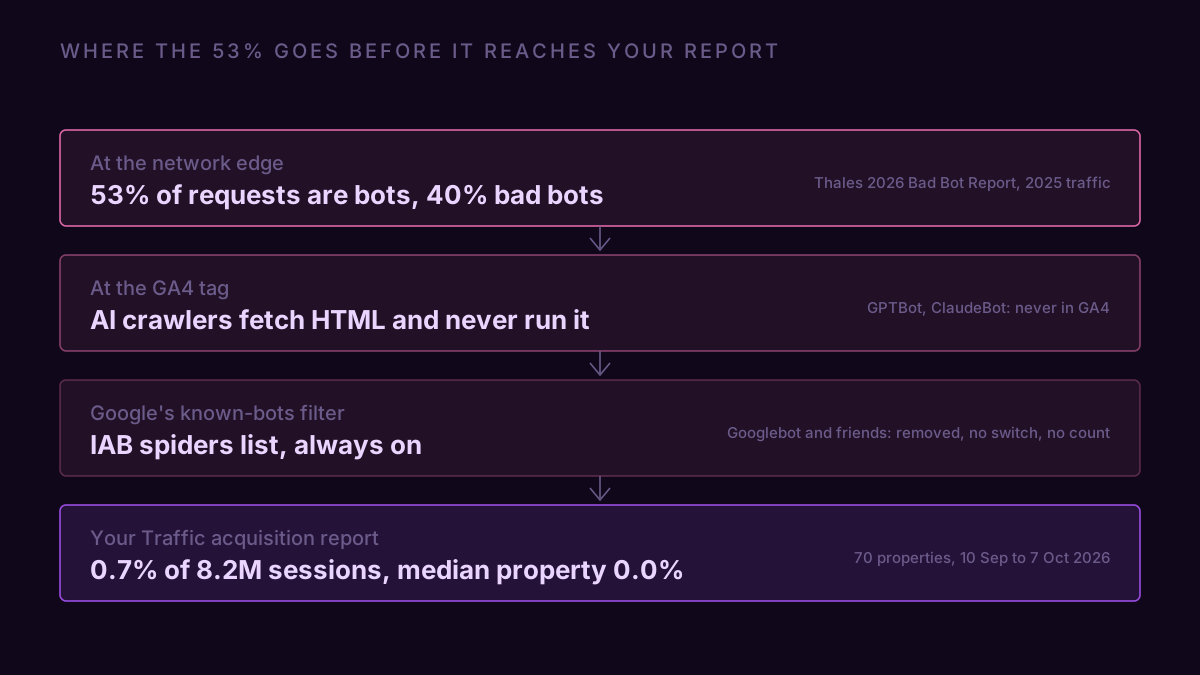
The 53% figure you have read is counted somewhere else: the 2026 Bad Bot Report from Thales puts bots at 53% of internet traffic in 2025 and bad bots at 40% of it, both measured at the network edge before a page loads, while GA4 recorded 0.7% of 8.2 million sessions as bot traffic across these 70 properties, because GA4 counts only sessions where a browser ran the tag. The AI crawlers fetch HTML and never run JavaScript, so they never appear in GA4 at all. Googlebot does render pages, and it is on the IAB spiders list that Google excludes automatically, with no switch to turn the exclusion off and no count of what it removed. What reaches your report is the remainder: headless browsers that call themselves Chrome, and spam posted straight at your measurement ID. The 70 properties are the GA4 properties connected to ConvRadar with 28 full days of data in the window, so they are sites that went looking for a conversion diagnosis, not a random sample of the web.
How the share was measured, so you can repeat it on your own property
Every row in Reports → Acquisition → Traffic acquisition is a source and medium, split by campaign. A row counts as bot traffic when it trips four checks over 28 days: 50 or more sessions, an engagement rate under 10%, fewer than 1.2 views per session, and no conversions, which means no orders on a store and no key events anywhere else. GA4 counts a session as engaged when it lasts longer than 10 seconds, views a second page or fires a key event, and the 10 seconds is a setting on the web data stream that goes up to 60, so a row of real visitors clears 10% engagement under any setting. The thresholds are absolute on purpose. A rule that compares a row with the site average stops working the moment the bots are the site average, which is what happens on the 94% store below. In this set the fourth check was orders, and 28 of the 70 properties record no purchases at all, so on those it never bound and 8 of them had rows that tripped the other three.
The rule is strict in one direction. A row of real people who close the tab in two seconds trips it too, so on a paid medium the share is an upper bound on bots and an exact count of clicks you paid for and never saw. It misses the other direction entirely: a bot that waits 11 seconds counts as engaged. And it ignores sessions with no source and no medium, 11,172 of them on 9 of the 70 properties, which start without a page view and belong to the unassigned problem, not to this one.
The distribution: a switch, not a percentage
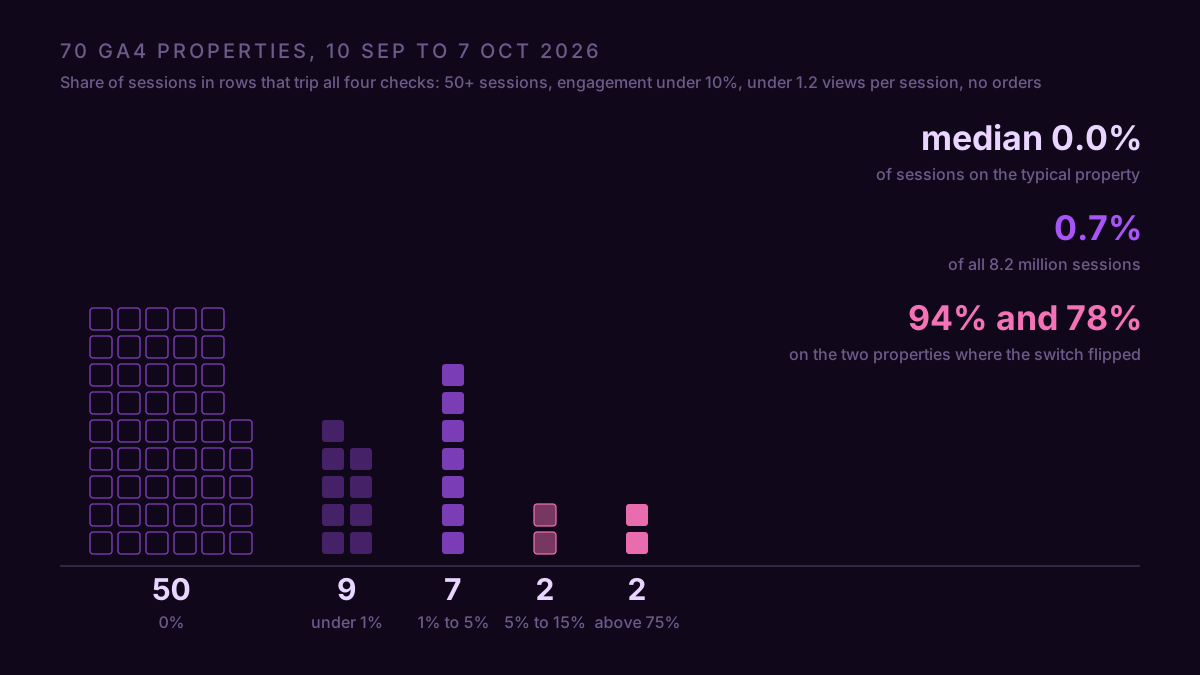
The two tails are what matter. 50 properties had not a single row that tripped all four checks. At the other end, one media site had 3,891 of 4,969 sessions in a Direct row whose top country was Hong Kong, 8% engaged, 1.11 pages per session, which is 78% of the property. One online store had 44,647 of 47,443 sessions in a Direct row whose top country was Singapore, which is 94%. That row ran at 6% engaged, 8 seconds on average and 0.51 pages per session, under 1 because sessions that end before a page view still count as sessions.
Size is the dividing line. The four properties above 500,000 sessions a month had 52 bot sessions between them out of 5.7 million. Drop those four and the share across the remaining 66 properties is 2.3% of sessions, against 0.7% across all 70. The 44,647 automated sessions that were 94% of a store doing 47,443 would have been 2.2% of a store doing 2 million, and the same run hits both. Business model changes less than size: 8 of 37 ecommerce properties had any bot rows, 7 of 20 lead generation and booking sites, 5 of 13 SaaS and media properties, and each group had one or two above 5%.
The 54 properties with 28 full days in each of the three windows from 16 July to 7 October show the same shape over time. Properties with at least one bot row went from 13 to 15 to 19 of 54. The worst property went from 11% to 37% to 94%, three different properties each time. The share of all sessions in the cohort went 0.4%, 0.1%, 0.7%, and the median stayed at 0.0% in all three windows. That is a wave rather than a tide: the Singapore traffic that stores started reporting in September 2025 shows up here as one property going from nothing to 94% inside a month, a few more going from nothing to a few percent, and the typical property never moving.
What it does to a store's numbers when it hits
The 94% store is the worked example because it shows the whole mechanism in one month. In the two 28-day windows before, it recorded 1,089 and then 3,020 sessions. Then 47,443, of which 44,647 sat in one Direct row with Singapore as its top country.
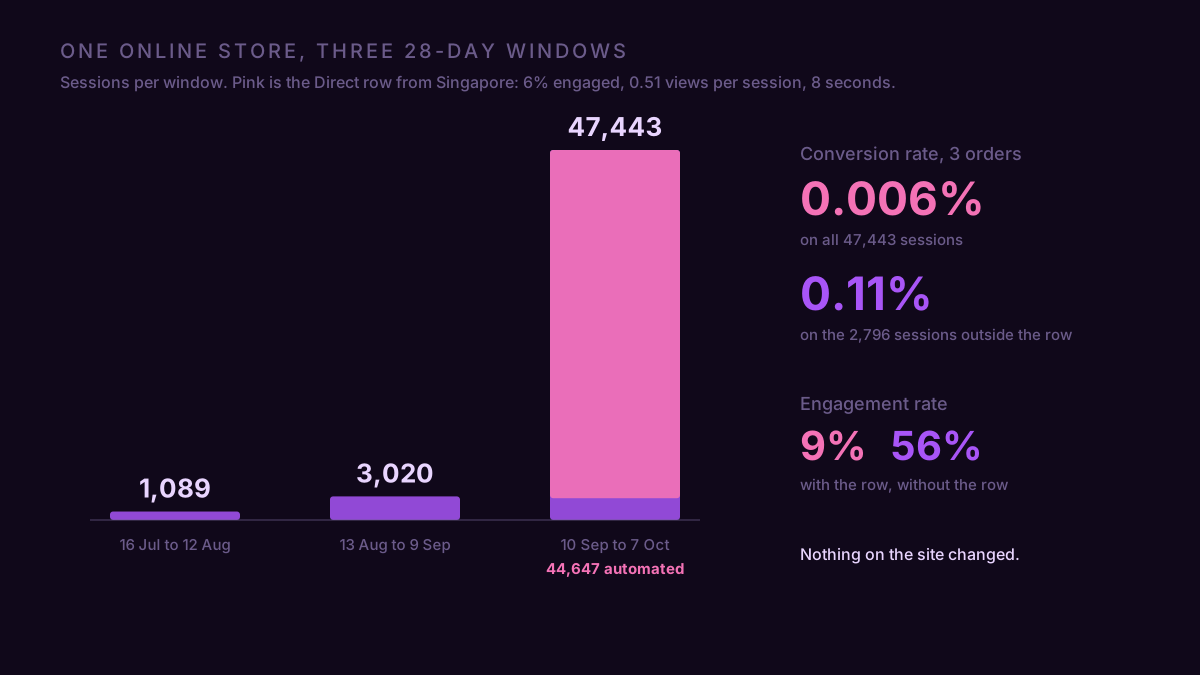
Three orders came in during those 28 days. On all 47,443 sessions that is a conversion rate of 0.006%, a number that reads like a dead checkout. On the 2,796 sessions outside the bot row it is 0.11%, 17 times higher. Engagement rate reads 9% on the full property and 56% without the row. New users, average engagement time, revenue per session, every rate with sessions underneath it moved the same way, and nothing on the site changed.
That one store is 44,647 of the 58,351 bot sessions in the whole set, so the totals describe it: 83% of all bot sessions sat in Direct rows and 79% in rows whose top country was Singapore. Take the store out and the remaining 13,704 bot sessions on 19 properties look different: 31% in referral rows, 28% in Direct, 22% in paid, 12% in custom-tagged rows and 7% in email, with the United States, Hong Kong and the United Kingdom as the top countries and Singapore at 9%. Counted by property, Direct carried a bot row on 2 of the 20 properties that had any; referral rows did on 12, paid rows on 7, custom-tagged rows on 5 and email on 2, each of those rows at most 1,452 sessions. Direct is where the floods arrive. Referral and paid rows are where the small, steady leaks sit. How much Direct is normal is 18.8% of sessions on the median property, and the new-user share of the row is what separates a flood from customers.
Two of the small patterns have a shape you can recognise. One referrer domain appeared on four unrelated properties in the set with 0% to 1% engagement, 1.00 pages per session and 0 to 2 seconds, between 72 and 1,452 sessions each; a referrer that touches four separate sites with identical zero behaviour is software, and the domain is not named here because a referrer header can carry any name. And one booking site had 2,040 sessions from Instagram and Facebook ads at 4% to 7% engagement, 1.0 pages and 5 to 9 seconds, which moved its conversion rate from 0.96% to 1.00% once removed. GA4 cannot tell a click bot from a person who closed the in-app browser before the page painted. It can tell you that every one of those clicks was paid for.
How to check how much of your GA4 traffic is bots
Open Explore → Blank, set the last 28 days, put Session source / medium in rows and Sessions, Engagement rate, Views per session and Key events in values, and flag every row with 50 or more sessions, engagement under 10%, fewer than 1.2 views per session and no key events: those rows' sessions divided by the property's sessions is your bot percentage. The standard Traffic acquisition report shows Engagement rate and Key events by default but not Views per session, which needs the Editor role to add, so the exploration is the path that works on any access level. The Direct row is where a flood will be; the referral and paid rows are where the small ones hide.
If a row trips the checks, read every rate you care about on engaged sessions only before deciding anything, because the 0.006% above was never a checkout problem. To see the property without a country's traffic, click Add comparison on any standard report and set Country, does not exactly match, the row's top country; it removes real visitors from that country too, so the engaged-session view is the better number when the country matters to you. The step-by-step for a flood, including the newer kind that fires add-to-cart and checkout events, is in the Singapore bot traffic article. If the row is a paid medium, the question goes to the ad platform, and a conversion rate that dropped after a spike is a reporting problem before it is a funnel problem.
The number the exploration will not hand you is your conversion rate without those rows. Connect GA4 to ConvRadar and ask Claude or ChatGPT which source rows had engagement under 10% and no conversions in the last 28 days, and you get the rows, their sessions, and your conversion rate with them and without them.
On 50 of these 70 properties the answer was no row at all. On one it was 94%.