If GA4 suddenly shows thousands of sessions from Singapore, or from China, they are not visitors. They are automated browsers that load your pages, run your analytics tag and leave within a second. Site owners have reported the pattern in Google's Analytics community since mid-September 2025, Google has not shipped a fix, and in 2026 a newer variant started doing something the first one never did: adding products to the cart and opening checkout.
None of this costs you revenue. Nobody in those sessions buys. What it costs you is the ability to read your own numbers, because every rate in GA4 divides by sessions or users, and those are exactly what the bots inflate.
What bot traffic is, and which bots GA4 actually sees
Bot traffic is any request to your site made by software rather than a person. Most of it never reaches GA4, and it helps to know why, because the part that does reach it is a specific kind.
Google Analytics is a JavaScript tag. A visit only counts if something loads the page in a browser and runs that script. Search-engine crawlers and AI crawlers such as GPTBot and ClaudeBot fetch your HTML and do not execute JavaScript, so they show up in your server logs and never in GA4. Bots that announce themselves in the user-agent string, the ones on the industry's known-spiders list, are excluded by GA4 automatically, and Google gives you no switch and no count for that filter.
What gets through is software that drives a real browser, usually headless Chrome running in a cloud data centre, and reports itself as an ordinary desktop Chrome user. GA4 cannot tell it from a person by its browser string, so it counts it. Price scrapers, ad-verification crawlers, security scanners and plain traffic generators all work this way. The Singapore traffic is one of them: GA4 assigns a location by IP address, and when the machines sit in Singapore or Chinese data centres, that is the country your report shows.
One older kind also reaches GA4 without a browser: spam that posts fake hits straight to your measurement ID. It gives itself away with a hostname that is not yours, and GA4's hostname filter handles it.
How the Singapore traffic looks in your reports
The pattern is consistent across the stores that have reported it. Sessions arrive in the Direct channel, on desktop, in Chrome on Windows. Each one sees a single page, often the homepage or a URL with parameters no shopper would type, and stays for under a second with no scroll and no click. The volume comes in bursts: a quiet week, then a day with ten or a hundred times the normal traffic, then quiet again.
The signal that matters is engagement. GA4 counts a session as engaged when it lasts longer than ten seconds, views two pages or fires a key event. Real visitors on a typical store are engaged somewhere between a third and two thirds of the time. These sessions almost never are.
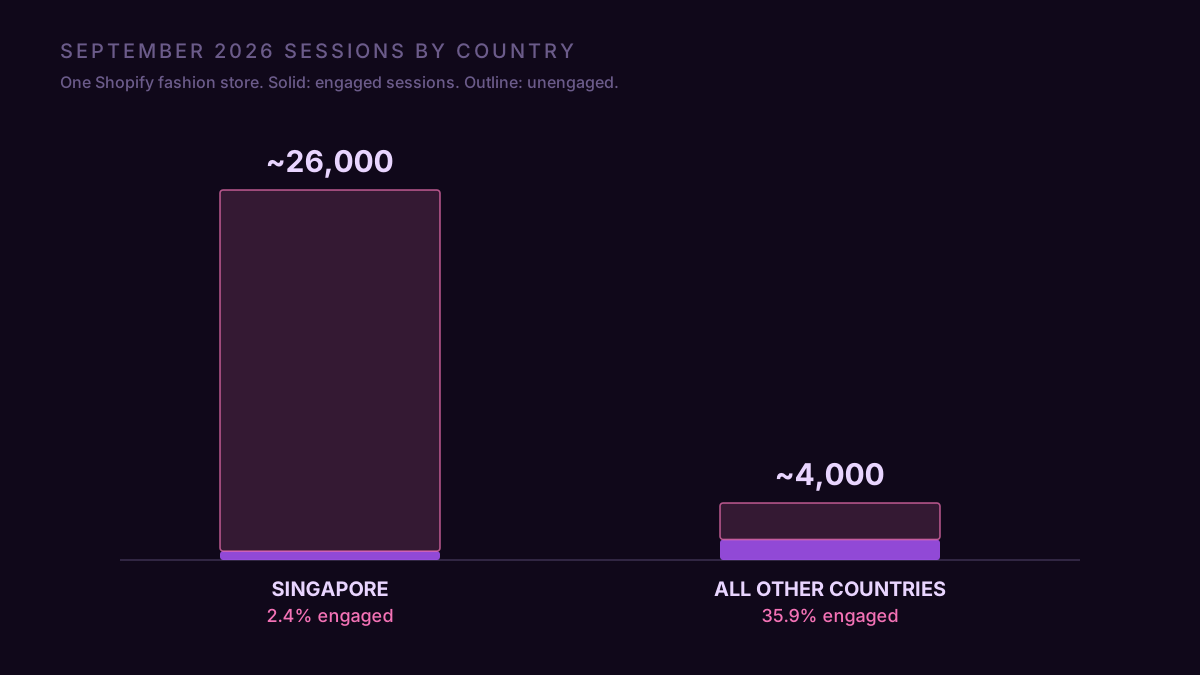
In one Shopify fashion store we work with, Singapore sent about 26,000 of the roughly 30,000 sessions recorded in September 2026, and 2.4% of them were engaged, against 36% for every other country combined. On its worst day the Direct channel on desktop took in more than 12,000 sessions, where it normally sees about 20.
What it does to your numbers
Bots add sessions and add nothing else, so every rate built on sessions falls. Conversion rate drops, engagement rate drops, revenue per session drops, and none of it reflects a change on the site. That store's September conversion rate read 0.007%, two orders on about 30,000 sessions, which looks like a broken checkout and is a broken denominator.
The damage spreads past the traffic report. New users jump, so the new-versus-returning split moves. Average engagement time falls. If you compare this month with last month to judge a redesign or a price change, the comparison is comparing two different populations. Before reading any rate after a spike, check it against the same rate on engaged sessions only. If the two agree, the bots did not change the answer. If they split, the number you were about to act on belongs to the bots.
The newer wave reaches the cart and checkout
The first wave stays in the traffic numbers. A newer one, seen in late September 2026, does not. It adds products to the cart and opens checkout, which puts it inside the ecommerce funnel, where a store decides what to fix and where ad platforms decide what to bid on.
In the same store, over four days, desktop sessions produced about 1,700 add-to-cart events and about 1,900 checkout starts, with no shipping step, no payment step and no orders. Almost all of those checkouts came from sessions that landed directly on the Shopify checkout URL, which no shopper does. And this wave did not mainly come from Singapore: a large share came from US, Swedish and Irish cities that host big data centres, so a country filter leaves it in place.
There is a simple test for it that works whatever country the traffic claims. A person has to put something in the cart before checkout means anything, and most carts are abandoned, so on a real store begin_checkout events stay well below add_to_cart events, usually a small fraction of them. In that store's clean August days it was 7 checkouts per 100 carts. In the bot days it was 109 checkouts per 100 carts. More checkouts than carts, with no payment step behind them, is automated traffic.
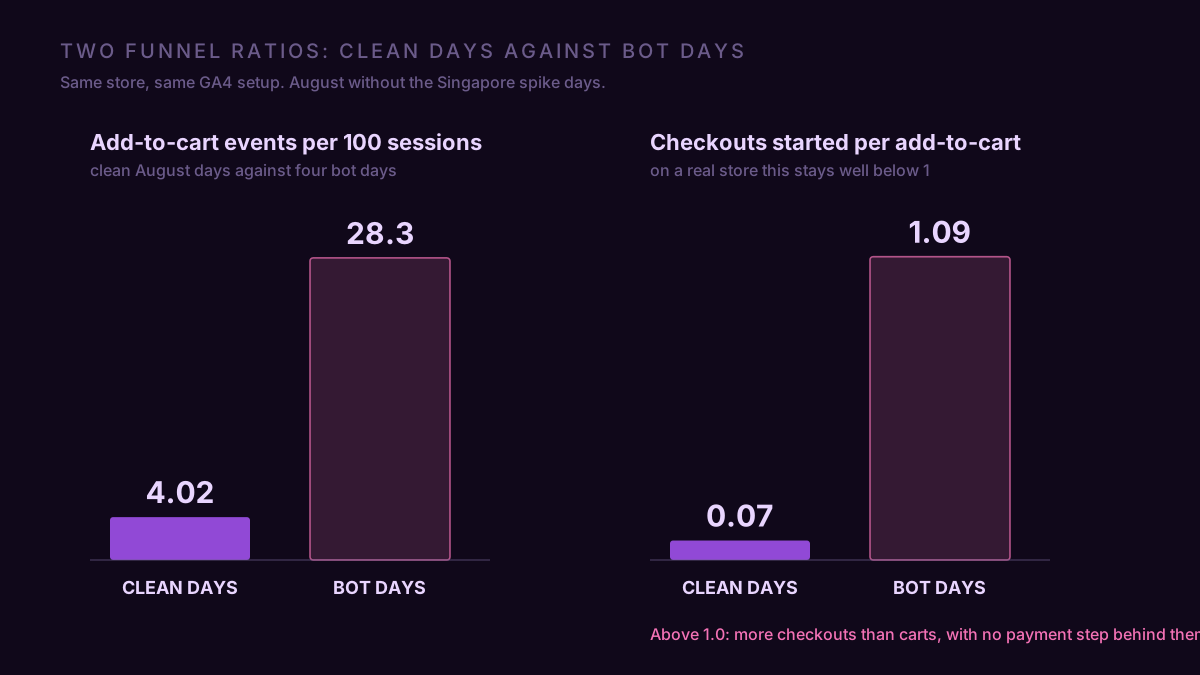
The same chart shows why this wave is more dangerous than the first. The add-to-cart rate went up, from about 4 add-to-carts per 100 sessions to about 28. An owner reading that number would conclude the product pages improved sevenfold in a week. A store that shifts ad budget toward its best-carting products would shift it toward the ones the bots clicked.
The test also separates bots from the more common reason for checkouts without purchases. If shipping and payment steps fire and purchase does not, real people are paying and your purchase tracking is broken, which is a GA4 and Shopify mismatch, not a bot problem. If nothing fires after checkout opens, it is a bot. On Shopify you can confirm it in Orders → Abandoned checkouts: a bot run leaves dozens of checkouts with no contact details for the same few days.
What to do about it
GA4 will not clean it for you. Its data filters cover internal traffic, developer traffic and unwanted hostnames, none of them can target a country or a behaviour, and they apply only to data collected after you create them. What you can do is read around it.
For the Singapore wave, click Add comparison at the top of any standard report, such as Reports → Acquisition → Traffic acquisition, and set Country does not exactly match Singapore. It changes the view, not the stored data. In the example store it brought September back from about 30,000 sessions to about 4,000 and from 7% engaged to 36%.
For the checkout wave, build a session segment in Explore → Blank → Segments that excludes sessions whose Landing page + query string contains /checkouts/. To find your own bot days, open Explore → Free form with Date in rows, Device category in columns, and Sessions and Engaged sessions as values: a day where desktop sessions jump tenfold while engaged sessions stay flat is a bot day.
Check one thing that costs money directly. If add_to_cart or begin_checkout is imported into Google Ads or Meta as a conversion, bot checkouts are feeding the bidding. In Google Ads, Goals → Conversions → Summary shows which events count as primary; for most stores only purchase should.
Keeping the bots out of GA4 altogether means blocking them before the page loads, at a firewall or CDN, by country or by data-centre network. On Shopify you cannot put your own firewall in front of the store. Shopify Plus stores can ask Shopify Support to turn on checkout bot protection, and every plan has captcha on forms and login. For everyone else, reading around it is the realistic fix, and the conversion rate drop diagnostic is the right next step whenever a rate moves after a spike.
If your September looks like this one, the first thing to know is how much of it is noise and what your conversion rate is without it. Connect your GA4 to ConvRadar and ask Claude or ChatGPT how much of the month is noise: each traffic source comes back with a noise score, you get the share of sessions that is noise and the conversion rate with and without it, and the GA4 steps to clean it up.