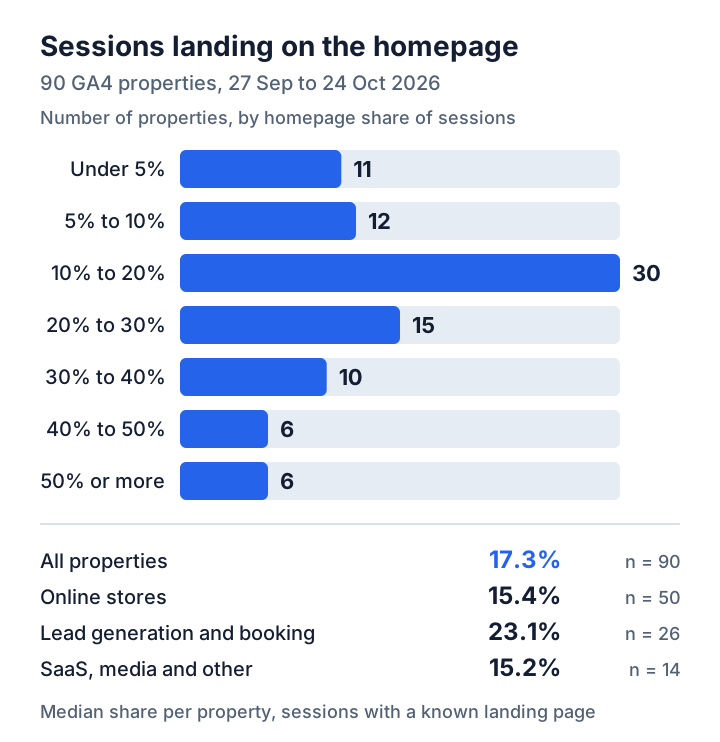
17.3% of sessions started on the homepage on the median of 90 Google Analytics 4 properties connected to ConvRadar between 27 September and 24 October 2026, and 82.7% started on another page. The share counts sessions with a known landing page. The middle half of the 90 run from 9.8% to 26.0%. Six start half their sessions or more on the homepage, eleven under 5%.
15.4% of sessions on the median ecommerce store started on the homepage, across 50 online stores connected to ConvRadar, 27 September to 24 October 2026, with the middle half between 9.4% and 23.2%. Lead generation and booking sites run higher, 23.1% on the median of 26, and SaaS, media and other properties 15.2% (14). The lead-site gap sits in small sites. Under 10,000 sessions in the 28 days, lead and booking sites started 36.2% of sessions on the homepage against 18.7% for stores, 16 sites against 20. Above 10,000 the order flips: 10.3% against 13.9%, 10 sites against 30.
Older figures sit on both sides. Substrakt's 2025 report on 87 arts organisations put the homepage at 17.2% of sessions in the UK and 15.2% in North America during 2024. ClickZ quoted around 30% in 2015 from Schuh, a UK shoe retailer, and from one consultant's retail clients; 9 of the 50 stores here reach 30%.
How many landing pages carry a website's traffic
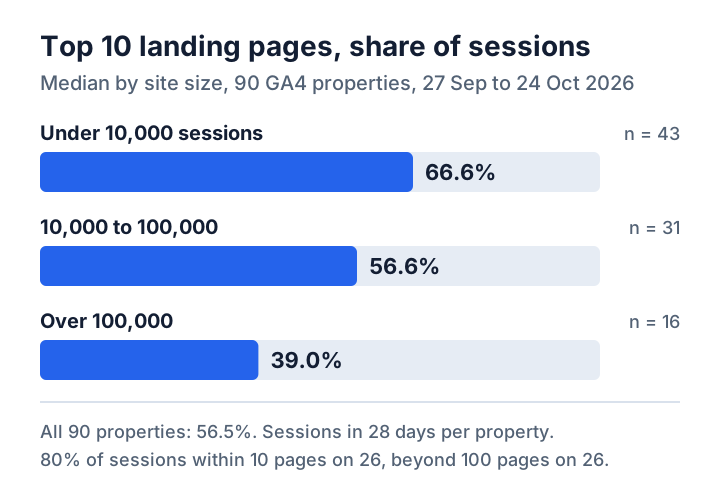
The 10 biggest landing pages held 56.5% of sessions with a known landing page on the median property in the same 28 days. On half the properties, half of all sessions started on 7 pages or fewer. Reaching 80% splits them: 26 properties get there within 10 pages, another 26 need more than 100. On 63 of the 90 the biggest landing page is the homepage.
The share falls as sites grow: 66.6% on the median property under 10,000 sessions in the 28 days, 56.6% between 10,000 and 100,000, and 39.0% above 100,000.
Two online stores in the set each had more than 810,000 sessions in the window. On one, the top 10 landing pages held 70.7% of sessions and 19 pages reached 80%. On the other, the top 10 held 18.4%, and 80% took 40,378 of the 197,063 pages that started at least one session. A fix on 10 pages reaches seven sessions in ten on the first store and fewer than one in five on the second.
Do 20% of pages get 80% of traffic?
Yes for landing pages on 67 of 90 GA4 properties connected to ConvRadar, 27 September to 24 October 2026: on those 67, 80% of sessions started on a fifth of the URLs that started any session, or fewer. The median property reached 80% within 12.8% of its landing URLs and the average property within 15.6%.
Chartbeat's Pareto study of thousands of publisher sites found the average site took 80% of its pageviews from 21% of its articles, with network data from January to September 2022. Chartbeat counts pageviews of articles; the 15.6% counts sessions by the page they started on, with every typo, old campaign URL and filtered variant that started one session in the denominator.
Which traffic lands on the homepage
Paid traffic lands deep. 7.5% of paid sessions started on the homepage on the median property, about a third of the Google organic share, where paid means a source / medium such as google / cpc, a paid social medium, display or shopping. Paid landed there less often than Google organic on 49 of 65 properties. Email and AI assistants did the same, on 17 of 23 and 23 of 32; where AI visits land instead has the pages they reach.
Direct has no pull to the homepage. It landed there less often than Google organic on 46 properties and more often on 35, so a big Direct row is no sign of people typing the address. How much Direct traffic is normal is measured on its own; Google organic's homepage share by business type is in the organic search benchmark.
Mobile lands on the homepage at about three quarters of the desktop rate on the median property, and lower on 57 of 90.
Ad and email visitors meet the site on an inner page. Check that page before redesigning the homepage for them.
Does the homepage convert better than other landing pages?
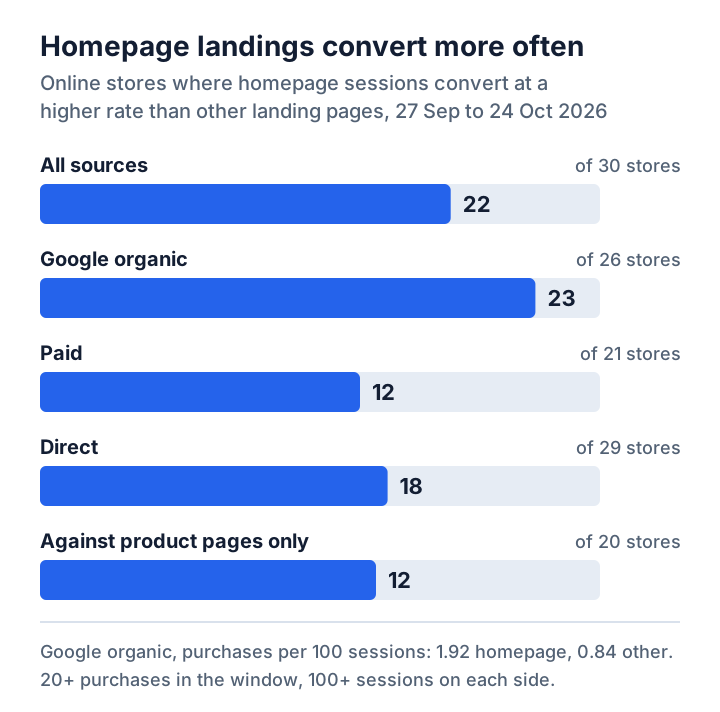
Homepage landings had a higher ecommerce conversion rate than other landing pages on 22 of 30 online stores connected to ConvRadar, 27 September to 24 October 2026: 1.36 purchases per 100 sessions that started on the homepage against 0.90 per 100 sessions that started elsewhere, on the median store. Paid traffic lands deep, so the two sides get different visitors. Reweighted to the channel mix of the other landing pages, the homepage still leads on 22 of 30.
Against product pages alone the gap narrows. On 20 online stores connected to ConvRadar with a product path such as /products/ or /p/ in their URLs, homepage landings converted at 1.01 purchases per 100 sessions against 0.75 for product-page landings on the median store, 27 September to 24 October 2026, and the homepage led on 12 of the 20.
The gap is widest inside Google organic: 1.92 purchases per 100 homepage sessions against 0.84 for the rest of Google organic on the median of 26 stores, with the homepage ahead on 23. Inside Direct it led on 18 of 29 stores and trailed on 11. Inside paid traffic, 12 of 21.
An online store with about 132,000 sessions in the 28 days started 23.4% of them on the homepage. Homepage sessions converted at 6.22 purchases per 100 sessions and sessions on every other landing page at 1.71. Inside Google organic the split was 4.09 per 100 on 6,144 homepage sessions against 0.38 on 52,216 sessions that started on other pages. GA4 does not keep the search query, so the next step is in Search Console: filter the Performance report to the homepage URL and to queries containing the store's name, then set those clicks against the 6,144. If the store's name carries most of them, the 4.09 belongs to people who chose the store before they searched, and the pages to work on are the ones converting 0.38.
ConversionTeam's 5.1% for homepages and 4.7% for product pages, published in September 2026, are median conversion rates of the control in A/B tests for 19 ecommerce clients, 71 tests on homepages and 167 on product pages. The page does not say the denominator is sessions that started on the tested page, so neither is the number to set against 1.36 and 0.75.
Homepage sessions were also engaged more often, 65.6% against 51.5% for the rest on the median of 84 properties, ahead on 58.
Sessions with no landing page
3.1% of sessions had no landing page on the median of 91 properties in the same 28 days. Ten had 10% or more. One store with 24,361 sessions recorded a landing page for none of them. The bucket holds (not set), empty rows and paths starting /web-pixels@, the address of Shopify's custom pixel sandbox. Google's help page on (not set) gives one cause for this dimension: a session without a page_view event. On a property at 20%, a fifth of sessions sit in no landing-page row, and the page_view tag needs fixing before any landing-page decision.
How to read your own
Open Reports → Engagement → Landing page, set the last 28 days and sort by Sessions. The report's dimension includes the query string, so add every row that is the homepage: "/", rows starting "/?", language roots such as /en/, and /index.html if the site uses it. Divide by the total minus the (not set) row, and set the result against 17.3%, or 15.4% for a store. Add up the first 10 distinct pages the same way for the share to set against 56.5%.
For the conversion split, open Explore → Free form. Add Landing page and Session source / medium as dimensions and Sessions and Ecommerce purchases as metrics, or Key events for a lead or sign-up site, put Landing page in rows, and filter Session source / medium to exactly google / organic. Divide the homepage rows' purchases by their sessions, then do the same for the rest of the table. With fewer than 100 sessions on either side the comparison is noise.
Your 25 biggest landing pages, ranked
On a site where 10 pages carry most sessions, the work goes page by page. Connect GA4 to ConvRadar and ask Claude or ChatGPT for your 25 biggest landing pages by sessions. Each row comes back with sessions, engagement rate and the count of your main conversion, a purchase on a store or a sign-up or lead elsewhere, for sessions that started on that page, and blank or (not set) rows come back flagged. GA4's Key events column adds up every key event until you pick one from its menu, and on 41 of 68 properties in the key events study that column counts something besides the conversion or misses the conversion; the connector counts the conversion the property is set to. The rows mix every source, so a deep page low on conversions is often where paid or AI traffic lands; check its source / medium before rewriting it.
How the 90 properties were measured
The 90 GA4 properties are every property connected to ConvRadar by an outside client, active on 25 October 2026, with 28 days of data and 1,000 or more sessions between 27 September and 24 October 2026, 7.0 million sessions in all. ConvRadar's own and demo properties, app streams and stores connected through its Shopify app are excluded; Shopify stores connected through GA4 are in. One property that reported 99.9% of sessions on "/" is dropped, and the store with no known landing page counts only in the section on sessions with no landing page. Business type is the one the owner stated when connecting, or detected from the property's events where the owner left it blank. Homepage means "/", a language root such as /en/, /en-gb/ or /fi_FI, /index.html or /home. Paid, email and AI assistant traffic are grouped from session source / medium, not from GA4's channel groups. Purchases are GA4's Ecommerce purchases, a count of purchase events, divided by sessions. The conversion comparison uses stores with 20 or more purchases in the window and 100 or more sessions on each side; channel, device and engagement comparisons use properties with 100 or more sessions in each cut. Five properties that count 99% or more of sessions as engaged are left out of the engagement and conversion comparisons, three of them stores. Shares and rates are medians across properties unless a sentence names one property.
On 23 of 26 stores the people Google sent to the homepage bought more than the people Google sent anywhere else. If Search Console shows your name behind the homepage clicks, the inner pages Google sends people to are the work: on the median store they converted 0.84 purchases per 100 sessions, against 1.92 on the homepage.