Mobile converts at 1.2% and desktop at 1.9%, so mobile is 37% worse. Inside the checkout, mobile finishes at 44% and desktop at 49% — mobile is 10% worse. Same 2,800 Shopify stores, same year, both numbers from Littledata's panel. Which means the checkout is the part of the mobile experience that's very nearly fine, and it's the part everyone rebuilds first.
Run it per 1,000 sessions. Desktop gets 39 of them onto a checkout page and turns 19 into orders. Mobile gets 27 onto a checkout page and turns 12 into orders. Call the first rate checkout reach and the second checkout completion. Everybody benchmarks the second one.
If you came only for the number, here it is: 45% of started checkouts finish, 59% at the top quintile, 66% at the top decile, same panel. It's the least useful figure on this page. The five-point completion gap costs mobile about an order and a half per thousand sessions. The twelve sessions that never reached a checkout page cost it the other five and a half.
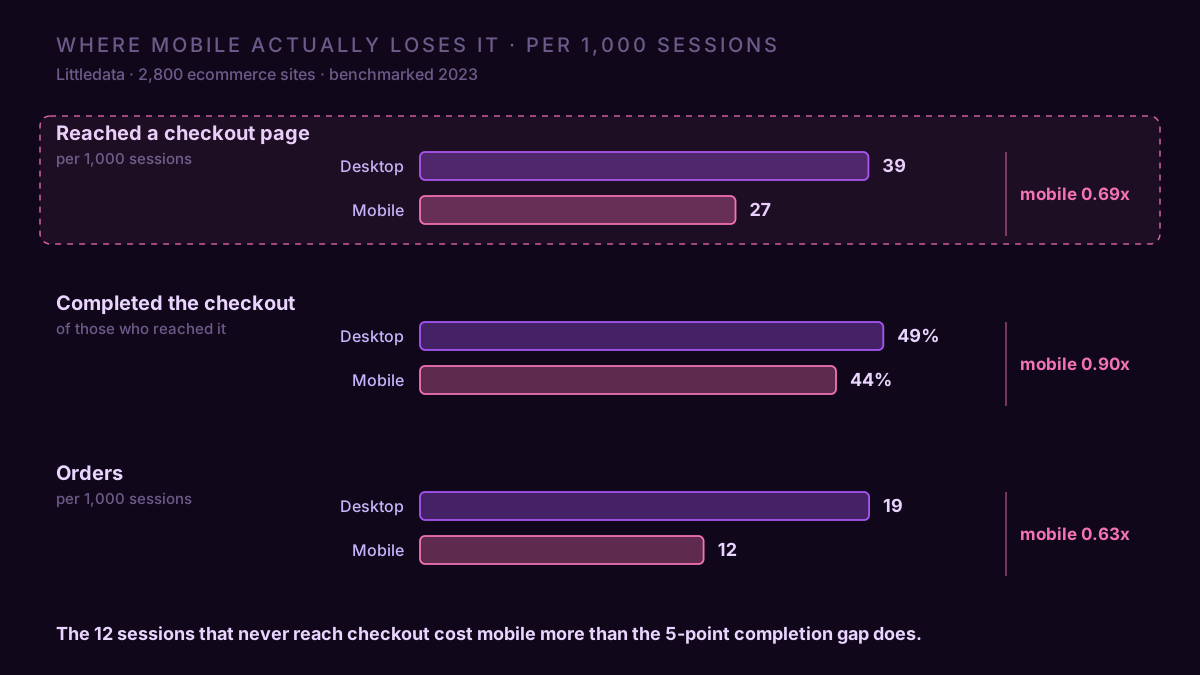
Three quarters of the mobile gap is upstream
The two ratios do the work. Mobile ends the whole journey at 0.63 of desktop and clears the checkout at 0.90 of desktop, so everything before the checkout page runs at 0.70. Compound those and you get the 0.63 back. Weight them the way compounding rates have to be weighted, by how far each one falls rather than by subtracting it, and the checkout carries a bit under a quarter of mobile's shortfall. The path to it carries the rest.
Both ratios come from the same panel. That's the only reason the comparison holds. Stack a checkout figure from one study onto a conversion figure from another and you're measuring the difference between two research methodologies, not two devices. Inside one sample the methodology cancels and the ratio survives.
It also matches what carts already told us: mobile's add-to-cart disadvantage mostly disappears once you filter to sessions that reached a product page. Same shape, one step later. Mobile shoppers who commit behave close to desktop shoppers who commit. Mobile's problem is how many of them commit.
So the checkout redesign that gets pitched every time mobile looks bad is arguing over a tenth. The cart page, the shipping estimate that only appears after you click through, the express-pay button that isn't on the cart drawer: those live in the seventy percent.
The step nobody publishes
Littledata publishes an add-to-cart rate, a checkout completion rate and a sitewide conversion rate for the same 2,800 stores. It doesn't publish the step between the cart and the checkout page, and neither does anyone else.
You can back it out. 4.6% of sessions add to cart, checkouts complete at 45%, sitewide conversion is 1.4%. For those three to hold together, about 68% of cart sessions have to reach a checkout page. That assumes all three are session-denominated, which Littledata never states, because the page defines none of its metrics. Treat 68% as the shape of the step, not its precise size.
Baymard's famous 70.22% cart abandonment rate, averaged across 50 studies, implies something similar: 29.8% of carts becoming orders, divided by a 45% checkout completion, puts the cart-to-checkout step near 66%. That one crosses two datasets and Baymard doesn't publish a denominator either, so it's a sanity check rather than a measurement. Two routes, one neighbourhood, and roughly a third of all carts dying on a page nobody benchmarks.
That gap is where the mobile money is, and there's no industry number to compare yourself against. You'll have to measure your own.
Why the published benchmarks run from 20% to 66%
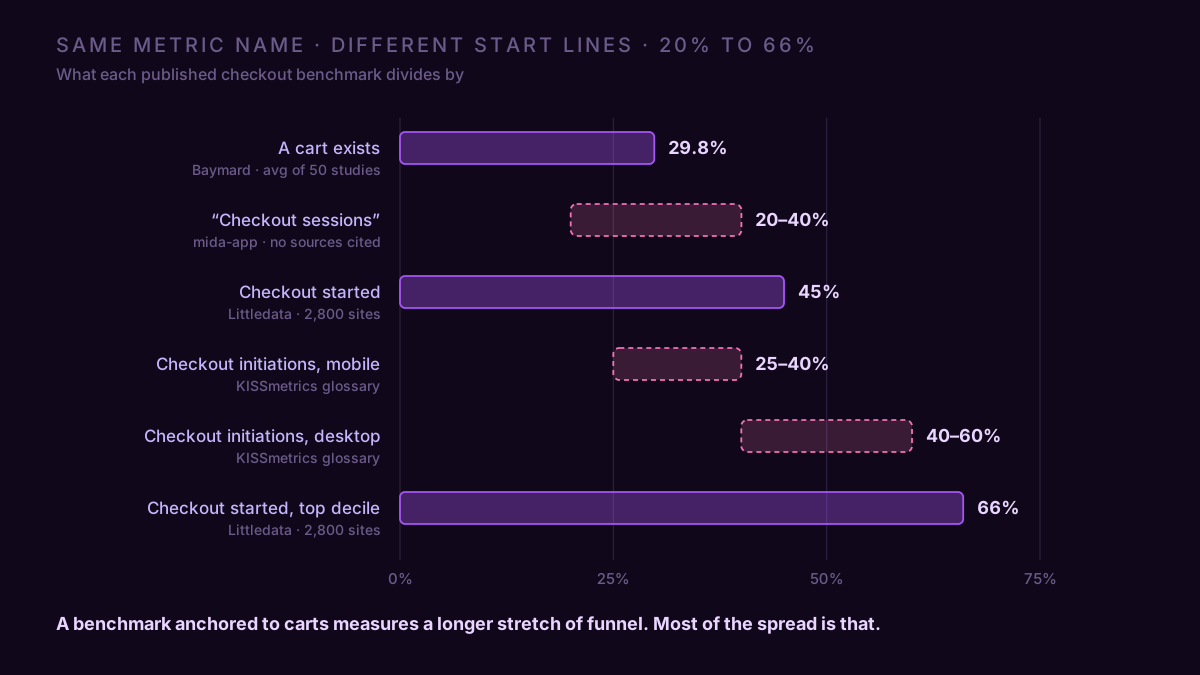
Search "checkout conversion rate benchmark" and you'll be handed 20–40%, 30%, 40–60%, 45%, 45–55% and 66%. Some of that is the usual denominator problem. Most of it is that the industry starts the clock in different places and calls every one of them "checkout."
| Published figure | Where the clock starts | Source |
|---|---|---|
| ~29.8% (as 70.22% abandonment) | a cart exists | Baymard, average of 50 studies |
| 20–40% typical, 45–55% "well-optimised" | "checkout sessions" | mida-app, no sources cited |
| 45% average | checkout started | Littledata, 2,800 Shopify sites |
| 40–60% desktop, 25–40% mobile | checkout initiations | KISSmetrics glossary |
| 66% | checkout started | Littledata top decile |
Read down that table and the spread stops looking like disagreement. A number anchored to carts is measuring a longer stretch of funnel than one anchored to the checkout page, so it lands lower, and 30% versus 45% is mostly that. The 66% is a top-decile figure being quoted as a baseline. And the KISSmetrics device split runs three and a half times wider than the one Littledata measured on real stores, which is what glossary pages that publish ranges without a panel behind them tend to do.
Our own benchmark playbook had this wrong until today. Its funnel table listed checkout-started-to-completed at a 30% median against a denominator of checkouts, which is fifteen points under what the largest published sample says. That row now reads 45%.
Here's the version worth keeping, and it's one source deep on purpose.
| Checkout completion | All | Mobile | Desktop |
|---|---|---|---|
| Average | 45% | 44% | 49% |
| Top 20% | 59% | — | — |
| Top 10% | 66% | 64% | 70% |
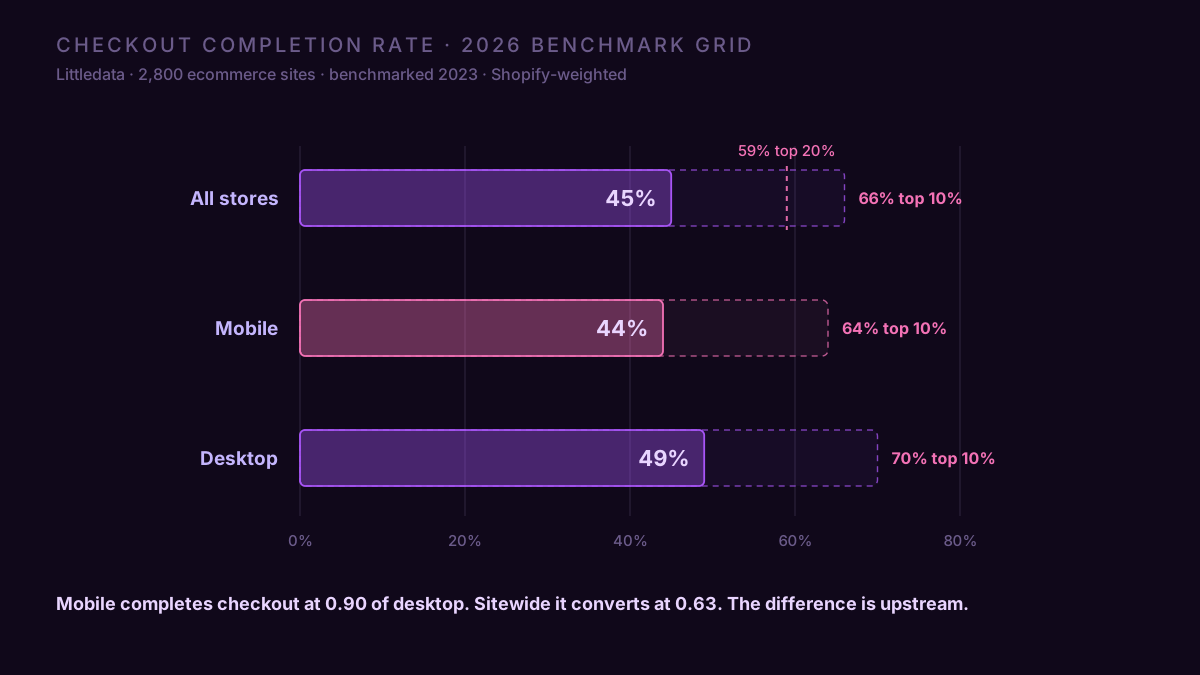
The fence that travels with it: Littledata, 2,800 ecommerce sites, benchmarked in 2023, Shopify-weighted. It's the largest panel I can find publishing this metric at all, and it's three years old, which is the honest state of the art. Express wallets have spread since, so the levels may sit a little low. The device ratio probably didn't move.
GA4 hands you yet another number
GA4's Checkout journey report counts users. Every published benchmark that says anything at all about its unit says checkouts or sessions, and a user is the smaller denominator of the two. Take a shopper who opens checkout on Monday, leaves, comes back Wednesday and buys: users scores that 1 out of 1, sessions scores it 1 out of 2. GA4's number comes out higher for the same behaviour, and nothing on the screen tells you so.
The report is a closed funnel and there's no toggle. Google's documentation is explicit: the Checkout journey includes only users who began at the Begin checkout step, and the report can't be customised. Anyone whose journey didn't open with a begin_checkout inside your date range is silently absent, starting with everyone who began checkout the day before your window did. The Purchase journey report sitting next to it has a toggle above the chart that opens the funnel. The Checkout journey has no toggle and no editing at all.
begin_checkout isn't a click. On Shopify's one-page checkout the event fires when the checkout page loads. So your "checkout started" population is people who arrived at the page, not people who pressed the button. Every shopper who tapped checkout and bounced on the load is missing from your denominator, which flatters your rate. On a GTM setup that fires the event on the button click, the same store measures a lower number and both are labelled the same thing.
Shopify's native app skips add_shipping_info. The Google & YouTube channel doesn't send the shipping event, so the Checkout journey's Add shipping step has nothing to count and everything downstream of it in a closed funnel is fiction. Diagnosing the steps properly needs a funnel exploration, not the built-in report.
Before any of this, check that GA4's purchase count is close to your store admin's. If it isn't, you're benchmarking a number your analytics invented, and a missing purchase turns a paying customer into a fake abandoner.
A store that was one week from rebuilding its checkout
Home and garden, 30 days, 61,200 sessions: 43,400 mobile, 17,800 desktop. 1,594 sessions reached a checkout page, 721 became orders at an $86 average.
Blended checkout completion: 721 ÷ 1,594 = 45.2%. Dead on the published average. The owner's read was that checkout was fine and the traffic was bad, right up until we split it.
| Sessions | Reached checkout | Completed | Orders | Conversion | |
|---|---|---|---|---|---|
| Mobile | 43,400 | 998 (2.30%) | 43.5% | 434 | 1.00% |
| Desktop | 17,800 | 596 (3.35%) | 48.2% | 287 | 1.61% |
Mobile completes checkout at 0.90 of desktop, which matches the panel. Mobile reaches checkout at 0.69 of desktop, which is the whole story. Now price the two candidate fixes:
Close the completion gap. Drag mobile from 43.5% to desktop's 48.2% and those same 998 checkouts yield 481 orders instead of 434. That's +47 orders, about $4,000 a month, in exchange for a checkout rebuild.
Close the reach gap. Get mobile onto a checkout page at desktop's 3.35% and 1,454 sessions arrive instead of 998. At mobile's own unchanged 43.5% completion that's 632 orders. +198 orders, about $17,000 a month, and it doesn't touch the checkout at all.
Four times the money, on the cheaper job. The blended 45.2% couldn't see either one, and the mobile-versus-desktop completion split, the number the owner had already found, pointed at the smaller of the two.
The work turned out to be the cart drawer: no shipping estimate until the checkout page, no express pay above the fold, and a "continue shopping" button sitting where the thumb lands. None of that is a checkout problem, and all of it happens after add_to_cart fires, which is why the funnel showed the loss and the checkout report didn't. That's the mobile conversion work that actually pays, and it's rarely the payment form.
Measuring your own version of this
Four numbers, per device, over the same window: sessions, sessions with a begin_checkout, purchases, and the two rates that fall out. In GA4 that's a free-form exploration with Device category as the row, Sessions as the metric, and an event-name filter, run twice: once for begin_checkout, once for purchase. Ten minutes, and you have to remember that a funnel exploration would have given you users instead.
The faster version is to stop doing it by hand. ConvRadar puts GA4 inside the assistant you already have open, and cr_get_funnel returns the whole set in one pass. Connect it and ask: "For the last 30 days, split by device: sessions, sessions with a begin_checkout, and purchases. Give me checkout reach and checkout completion for each, and tell me which of the two is further below desktop." The answer names the step, which is the only part of a benchmark that was ever useful.
A 45% checkout completion rate means your checkout is average. It says nothing at all about the third of your carts that never got there.