No day of the week gets the most ecommerce traffic across stores: among 48 online stores connected to ConvRadar, no day was the busiest on more than 13, over the 8 weeks from 31 August to 25 October 2026. Sunday was the busiest day on 13 stores, Tuesday on 10, Thursday on 8. The median share of every day of the week sat between 13.7% and 14.7% of a store's sessions, against 14.3% for an even split, and a weekend day brought as many sessions as a weekday on the median store. Sales split the same way: Sunday was the best sales day on 8 of 27 stores and the worst on 6.
Each store still has a busiest day. On the median store it brought 1.36 times the sessions of the quietest day, and on most stores it was a different day four weeks later.
Oribi's 2020 report on 204 online shops, October to December 2019, put weekends at "35% less traffic than weekdays for most online stores". Here a weekend day ran below a weekday on 24 of the 48. Metorik's count of more than 65 million WooCommerce orders from over 6,000 stores in 2025 put 12% to 15% of orders on each day of the week.
| Day | Share of sessions, median of 48 stores | Busiest traffic day on | Share of purchases, median of 27 stores | Best sales day on | Worst sales day on |
|---|---|---|---|---|---|
| Monday | 14.7% | 6 | 14.9% | 7 | 3 |
| Tuesday | 14.5% | 10 | 13.9% | 2 | 2 |
| Wednesday | 14.1% | 4 | 15.5% | 4 | 3 |
| Thursday | 14.2% | 8 | 14.4% | 3 | 3 |
| Friday | 14.1% | 2 | 13.7% | 2 | 3 |
| Saturday | 13.7% | 5 | 13.3% | 1 | 7 |
| Sunday | 14.3% | 13 | 13.3% | 8 | 6 |
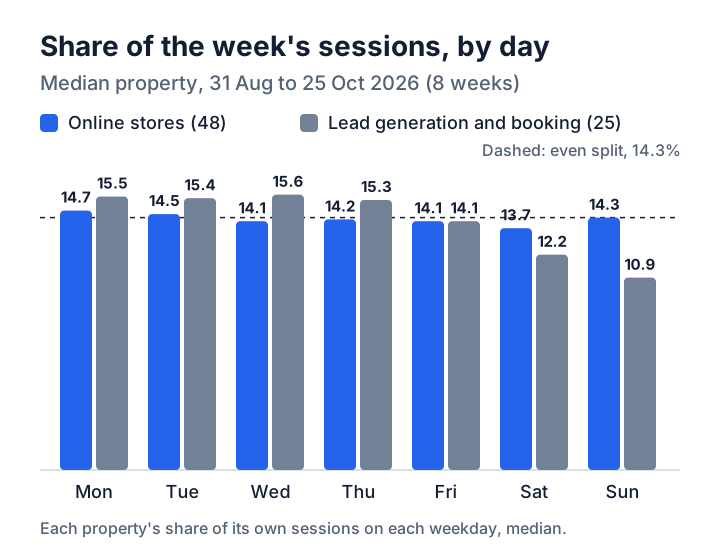
Lead generation sites lose 30% at weekends
A weekend day brought 0.70 of an average weekday's sessions on the median of 25 lead generation and booking sites connected to ConvRadar between 31 August and 25 October 2026, and weekends ran lower on 19 of the 25. Monday to Thursday each held 15.3% to 15.6% of the median site's week, Saturday 12.2% and Sunday 10.9%. The weekend dip was the same in the first and last four weeks on 21 of the 25 sites, where chance gives about 16. SaaS, media and other properties sat between stores and lead sites: a weekend day at 0.87 of a weekday, lower on 12 of 15.
On the median lead site a Saturday or a Sunday reads as a 24% drop against the Thursday before it, with nothing wrong. Before calling a sudden traffic drop, set the day against the same day of the week a week earlier. Whole-site lead rates by industry are in the lead generation conversion benchmarks.
Which day do online stores sell the most?
Sunday and Monday were the most common best sales days, the day with the most purchases on 8 and 7 of 27 online stores connected to ConvRadar with 100 or more purchases between 31 August and 25 October 2026, and the median share of purchases on every day of the week sat between 13.3% and 15.5%. Sunday splits stores: it was also the worst sales day on 6 of the 27. The busiest traffic day was the best sales day on 12 of the 27.
Do ecommerce conversion rates differ by day of the week?
On the median of 26 online stores connected to ConvRadar with purchases on every day of the week, the best day converted sessions into purchases at 1.52 times the rate of the worst between 31 August and 25 October 2026, against 1.22 that random variation produces at the same purchase counts. On the 14 stores with 1,000 or more purchases the gap was 1.33 against 1.09. Part of that gap is more than random variation, and it falls on different days: Sunday was the best conversion day on 8 of 27 stores and the worst on 7. What those stores convert at overall, by industry, is in the ecommerce conversion rate benchmarks.
Weekends converted at 0.96 of the weekday rate on the median store, and lower on 15 of 27. Oribi's 2.5% on Tuesdays against 2.1% at weekends was one pooled rate for Q4 2019; on these stores the median Tuesday ran 1.18 purchases per 100 sessions, Saturday 1.08 and Sunday 1.25.
What is the best day to launch a sale or an A/B test?
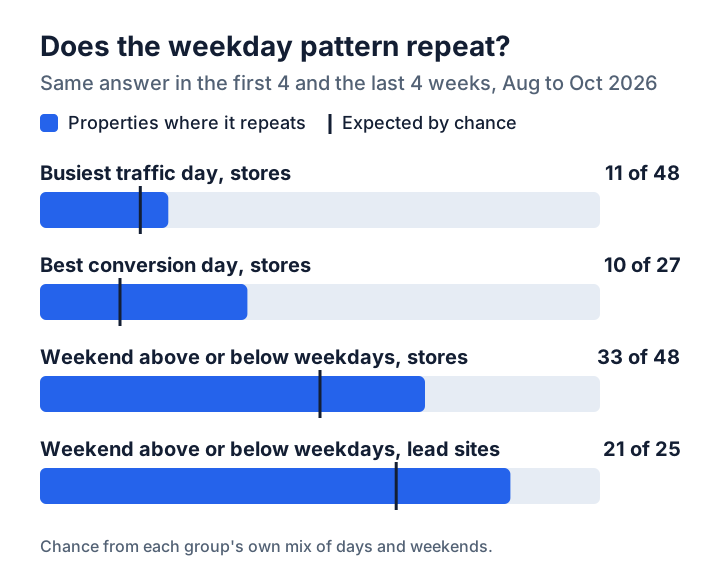
The busiest traffic day of an online store was the same in the first and last four of the 8 weeks from 31 August to 25 October 2026 on 11 of 48 stores connected to ConvRadar, about the 9 that the stores' own mix of days gives by chance, and the best conversion day on 10 of 27, against about 4. Split the 8 weeks into odd and even weeks instead and the counts are 11 of 48 and 6 of 27. On the 14 stores with 1,000 or more purchases, the best conversion day repeated on 6 between the halves and on 3 between odd and even weeks.
The direction of the weekend held up better. Whether weekends ran above or below weekdays repeated between the halves on 33 of 48 stores, 29 with odd and even weeks, where chance gives 24.
So on most stores a month of data does not name a best day to launch a sale or start an A/B test, and on the 10 where the best conversion day held, it is a day to check again before acting on it. Run tests over full weeks so the weekly cycle is balanced, and pick the launch day for the team's calendar.
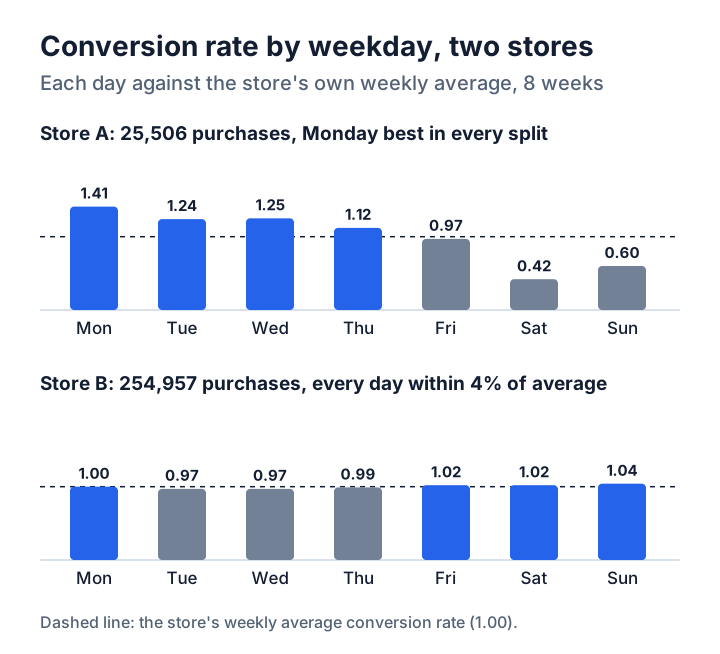
A store where the day matters, and one where it does not
An online store with 25,506 purchases between 31 August and 25 October 2026 converted Monday sessions at 1.41 times its weekly average, Saturday sessions at 0.42 and Sunday sessions at 0.60, and Monday was its best day in every split of the weeks. A weekend session there converted at under half the weekday rate. That gap is large and repeats, so this is the store where a weekday-weighted ad schedule has something to find, once paid weekend sessions are checked against the same curve.
An online store with 254,957 purchases in the same 8 weeks kept every day within 4% of its weekly average, and its best day changed with the split: Sunday in both halves, Monday and Friday in odd and even weeks. On a store like that, a weekly change in conversion is a conversion rate drop question, not a calendar one.
How to read your own
Open Explore → Free form, set the date range to the last 4 full weeks, Monday to Sunday, and switch on a comparison range for the 4 weeks before. Add Day of week name as a dimension and Sessions and Ecommerce purchases as metrics, and put Day of week name in rows. For a lead site, add Event count in a second tab with a filter on your lead event's name: that filter also narrows Sessions, and the Key events metric would add up every key event the property marks.
For each range, divide each day's sessions by the range's total, and each day's purchases or leads by its sessions. Average Saturday and Sunday and divide by the average of Monday to Friday: that is the weekend ratio to set against 1.00 for a store and 0.70 for a lead site. A busiest day or a best conversion day that differs between the two ranges is not a day to schedule around.
The odd-and-even-week split takes eight date ranges in GA4. Connect GA4 to ConvRadar and ask Claude or ChatGPT for sessions and purchases, or the count of your lead event, for each of the last 56 days: the assistant groups them by day of the week for both splits, so the busiest day, the best conversion day and the weekend ratio come back for each half side by side.
How the 88 properties were measured
The 88 GA4 properties are every property connected to ConvRadar by an outside client, active on 28 October 2026, with a web data stream, all 56 days of data and 2,000 or more sessions between 31 August and 25 October 2026, 16.7 million sessions in all: 48 online stores, 25 lead generation and booking sites and 15 SaaS, media and other properties. ConvRadar's own and demo properties and stores connected through its Shopify app are excluded; Shopify stores connected through GA4 are in. Business type is the one the owner stated when connecting, or detected from the property's events where the owner left it blank. Days follow each property's GA4 reporting time zone. A day's share is the property's sessions on that day of the week over the 8 weeks divided by its 8-week total, and shares, ratios and rates are medians across properties. Purchases are GA4's Ecommerce purchases, a count of purchase events. The random-variation benchmark redraws each store's daily purchases at its own average conversion rate, 200 times. Chance for a repeated busiest day uses each group's own mix of busiest days; for the weekend direction it uses each group's share of properties with lower weekends. Monday 28 September had 34% more sessions than the median Monday across the panel, with one store at 2.76 times its usual Monday; without that week the median shares move by 0.1 points or less and Sunday stays the busiest day on 13 stores. US Labor Day, Monday 7 September, had 12% fewer sessions than the median Monday.
A day of the week earns a place in the ad schedule only after it shows up in both halves of your own 8 weeks; across 48 online stores, the busiest day did on 11.