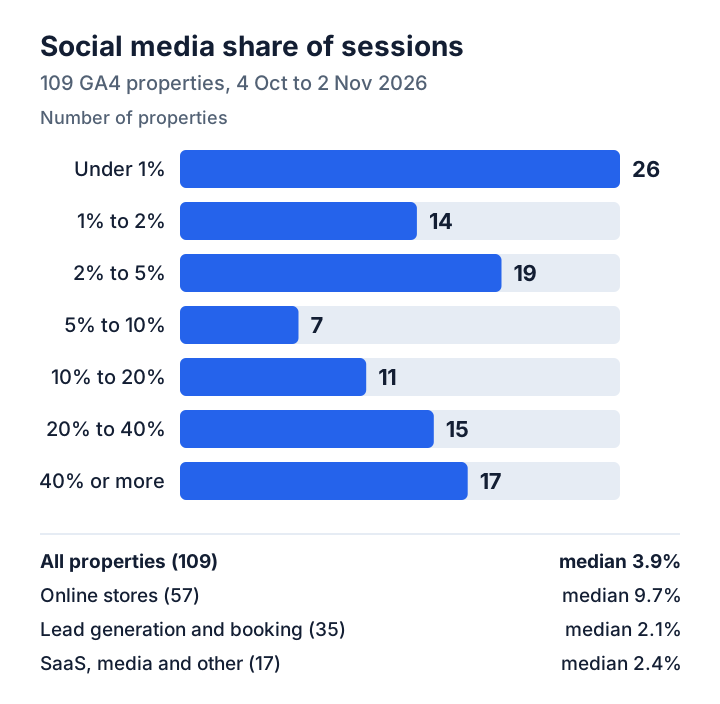
Social media brought 3.9% of sessions on the median of 109 Google Analytics 4 properties connected to ConvRadar between 4 October and 2 November 2026: 24.3% on the 51 that ran social ads and 1.2% on the 58 that did not. The count is GA4's Organic Social and Paid Social channels together. The middle half of the 109 properties took between 1.0% and 28.0% of their sessions from social; 26 took under 1%, and 32 took 20% or more. Running ads here means 100 or more Paid Social sessions in the 30 days, or 100 or more social sessions whose tags name an ad.
How much of an online store's traffic comes from social media
Online stores took 9.7% of their sessions from social media on the median of 57 stores connected to ConvRadar, 4 October to 2 November 2026: 27.7% on the 35 running social ads and 1.3% on the other 22. The middle half of the 57 stores sat between 1.9% and 35.5%. A store without social ads that measures itself against 9.7% is measuring itself against stores that run social ads; its own reference is 1.3%.
Why published social media traffic figures run from under 2% to 18%
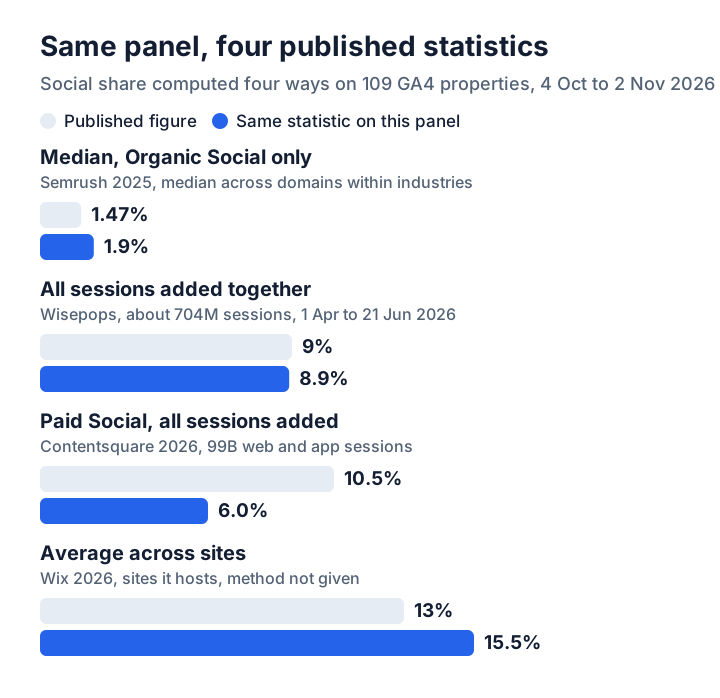
Published figures for social media's share of website traffic run from under 2% to 18% because each one measures something different. Semrush's 2025 channel study of more than 50,000 websites puts organic social at 1.47% of traffic, a median across domains within industries from Semrush's own traffic estimates. Wisepops counted social at 9% of about 704 million sessions on websites using Wisepops from 1 April to 21 June 2026, beside a separate 20% for paid traffic. Contentsquare's 2026 benchmark puts paid social alone at 10.5% of 99 billion web and app sessions. Wix gives 13% on average for the sites it hosts, and 18% for consumer stores, events, blogs, portfolios and photography.
On this panel the median property took 1.9% of its sessions from Organic Social, next to Semrush's 1.47%. Added up across all 10.3 million sessions, Organic Social was 2.8% and all social 8.9%; Wisepops does not say which of its two buckets holds paid social, so either figure can sit next to its 9%. Paid Social added up was 6.0%, next to Contentsquare's 10.5%, and the average property took 15.5%, next to Wix's 13%. The average runs far above the median because 32 of the 109 properties took 20% or more of their sessions from social while 26 took under 1%; the sum follows the five stores that hold half of the panel's social sessions.
How much social media traffic is paid versus organic
Paid Social was 48.0% of social sessions and Organic Social 52.0% on the median of 76 GA4 properties connected to ConvRadar with 100 or more social sessions between 4 October and 2 November 2026. On the 45 stores among them Paid Social was 70.0% on the median and outweighed organic on 25.
GA4 decides that split from the utm_medium tag, so the paid figure is a floor. A tagged social session counts as Paid Social only when its utm_medium matches ^(.*cp.*|ppc|retargeting|paid.*)$; most other mediums from a social site, and ad clicks that arrive untagged as facebook.com / referral, go to Organic Social, while some ad tags leave both social channels: facebook / banner and Instagram / display sent 1,306 sessions to Display on two properties. On five stores in this panel, 61% to 96% of the Organic Social sessions from Facebook, Instagram and meta sources carried mediums that name an ad: Meta placement values such as Facebook_Mobile_Feed and Instagram_Stories, written by Meta's {{placement}} URL parameter, a campaign or ad name, or fb-ad. The fix is in the ad's URL parameters in Meta Ads Manager: set utm_medium to a fixed paid_social and move {{placement}} to utm_content. A Reddit campaign tagged social_paid misses the same rule, as the Unassigned traffic article shows with the other mediums GA4 misreads.
Which social networks send the traffic
Meta sent 99% of social sessions on the median of 76 GA4 properties connected to ConvRadar with 100 or more social sessions from 4 October to 2 November 2026, counting Facebook, Instagram and sessions tagged with meta as the source. It passed 80% on 62 of the 76. Facebook was the largest single source on 39, Instagram on 14, and a source tagged meta on 10. TikTok sent sessions to 21 of the 76 and passed a tenth of their social traffic on 3.
GA4 files youtube.com under Organic Video, its own channel, so YouTube mostly sits outside these figures. YouTube sources brought 57,808 sessions to 33 of the 109 properties in the window, 96% of them to one store, and the 4,285 of that store's YouTube sessions tagged with medium social count as Organic Social.
Does social media traffic convert worse for online stores, and by how much?
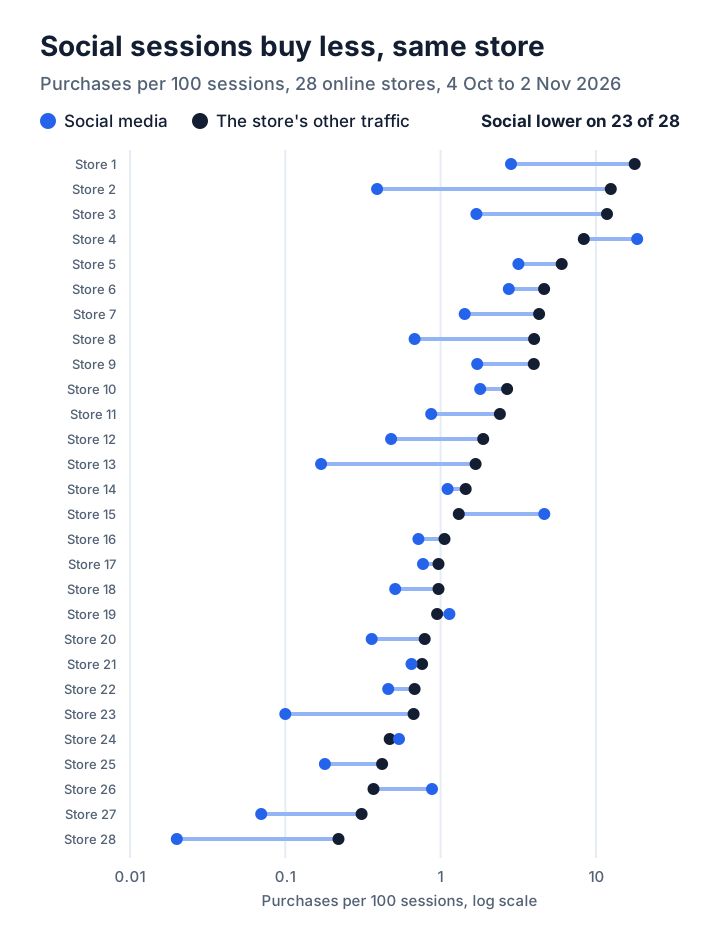
Social media sessions bought at 0.49 of the rate of the rest of the same store's traffic on the median of 28 online stores connected to ConvRadar, 4 October to 2 November 2026, and recorded fewer purchases per session on 23 of the 28. The median store recorded 0.74 purchases per 100 social sessions, and the median for other traffic was 1.38. If social sessions were as likely to buy more as to buy less, a split this lopsided would come up less than once in 1,000. Paid Social bought at 0.41 of the rest on the median of the 23 stores with 300 or more Paid Social sessions, lower on 20, and Organic Social at 0.53 on 27, lower on 22; compared with each other in the same store, Paid Social bought more on 10 of 22.
A second read of 15 of the 28 stores, split by device for 15 October to 11 November 2026, put 93% of their social sessions on mobile on the median against 68% of the rest, and the rest bought less on mobile than on desktop on 11 of 15. Compared mobile against mobile, social still recorded fewer purchases per session on 14 of the 15, at 0.37 of the store's other mobile traffic on the median, against 0.38 on all devices for the same 15 stores and dates.
GA4 credits each purchase to the session it happened in, so a shopper who finds the store on Instagram and buys a week later from a Google search counts for Organic Search and never for social. Ruler Analytics' multi-touch data, which spreads credit across visits, puts paid and organic social near 2% of sessions ending in a qualified lead or sale against about 5% for search, email and direct, as covered in conversion rate by traffic source. Meta Ads Manager by default credits its ads with purchases made within 7 days of a click or 1 day of a view, so it counts sales that GA4 files under the channel of the later visit.
How much traffic lead generation and service websites get from social media
Social media brought 2.1% of sessions on the median of 35 lead generation and booking sites connected to ConvRadar between 4 October and 2 November 2026. 11 of the 35 took under 1% from social. The 12 running social ads took 29.4% on the median, and the 23 without took 1.0%. This panel compares lead sites on traffic only: their key events count different things from site to site, as the key events article found on 41 of 68 properties from 19 September to 16 October 2026.
How to read your own social share
Open Reports → Acquisition → Traffic acquisition, set the last 30 days and set Session default channel group as the dimension. Organic Social plus Paid Social, divided by the Total row, is the share measured here; hold it against 27.7% for a store that runs social ads and 1.3% for one that does not (35 and 22 stores), 29.4% and 1.0% for a lead generation site (12 and 23). Then add Session source / medium as a secondary dimension and read the mediums inside Organic Social: Facebook_Mobile_Feed, an ad name or a campaign name there is ad spend counted as free traffic. A shared link that arrives with no referrer and no UTM tags counts as Direct, not social; the direct traffic benchmark measures that row on its own.
The same report shows purchases by channel for one window and one split at a time. Connect GA4 to ConvRadar and ask Claude or ChatGPT for sessions and purchases, or key events on a lead site, by session default channel group and device category for the last 30 days, then by session source / medium inside Organic Social: the phone-against-phone comparison above for your own site, and every ad tag sitting in Organic Social with its purchases or leads beside it.
How the 109 properties were measured
GA4 Data API reports were read on 3 November 2026 for every GA4 property connected to ConvRadar by an outside client with an active connection, 179 properties, for 4 October to 2 November 2026. The 109 in the panel, belonging to 108 clients, had 1,000 or more sessions in those 30 days; 13 had no sessions and 57 had fewer. ConvRadar's own and demo properties and stores connected through its Shopify app are excluded. Social means GA4's Organic Social and Paid Social channels in the default channel group; Organic Video, where YouTube goes, is not counted. Shares are computed per property, and figures are medians across properties unless a sentence says added up, average, or names one property. Business type is the one the owner stated when connecting, or detected from the property's events where the owner left it blank; properties with no type are counted with SaaS, media and other. Purchases are GA4 purchase events. The conversion comparison uses stores with 300 or more social sessions and 50 or more purchases; the chance figure is a two-sided sign test across stores. Four stores record more than 10 purchase events per 100 sessions on their social or other traffic, which can mean duplicated purchase tracking; without them social bought less on 20 of 24 stores at a median 0.52.
Networks and ad tags come from each property's 60 largest source / medium rows: facebook, fb, messenger, m.facebook.com and l.facebook.com count as Facebook, instagram and ig as Instagram, and sources named meta as Meta. Ad tags are Facebook, Instagram or meta sources whose medium fails GA4's paid rule and names an ad: a Meta placement value (Facebook_, Instagram_, Messenger_ or Audience_ prefixes, an, Others), fb-ad or ad, or one of the campaign and ad names found in this panel's tags. On every store the rows past the 60th hold too few social sessions to reach 100; two properties that are not stores could not be checked. The device read of 13 November 2026 covered 15 October to 11 November; Google returned errors for many of the largest properties that day, so it covers smaller properties more than the panel does, and it is used only for the phone comparison.